Your Personal
Training Analysis
Automatic performance analysis from every training session. Unique worldwide.
Activity Analysis determines your VO2max, VLamax, Critical Power, FTP, and Fatmax - fully automated from your regular workouts.
Live Activity Analysis
See your performance metrics in real-time

""It tracks my VO2max trends after every ride and shows exactly how many carbs I burned. This helps me optimize my recovery nutrition and avoid overtraining - essential for staying competitive.""
Why Activity Analysis?
You train hard - but do you know if it's working?
Most platforms only show pace and power. Activity Analysis reveals your actual physiology - VO2max, VLamax, metabolic efficiency - from every training session.
Performance Tracking Over Time
Manual Analysis Takes Hours
Analyzing training data manually is time-consuming and error-prone.
Automatic Analysis
Activity Analysis looks at every workout automatically - VO2max, VLamax, training zones, metabolic efficiency.
Prevent Overtraining
Weekly summaries based on Mader's method help you avoid overtraining and optimize recovery.
See Activity Analysis in Action
Every training session becomes a source of valuable insights
Performance
Tyre pressure
No tyre pressure data
Real-Time Analysis
Physics Analysis
Calculated power output, speed zones, and mechanical efficiency from your ride data.
Metabolic Insights
Track your fat burning, carbohydrate usage, and training stress scores in real-time.
Heart Rate Zones
Automatic heart rate zone detection and time spent in each intensity level.
Nutrition Tracking
Monitor your caloric burn and carbohydrate consumption to optimize your fueling strategy.
All metrics are calculated automatically from your ride data – no manual input required.
How Does Activity Analysis Work?
Three simple steps to unlock smart training insights
Connect Your Account
Link your Garmin, Wahoo or Hammerhead account. All training sessions are automatically synced to our platform.
Automatic Analysis
Every training session is automatically analyzed. Get VO2max, VLamax, training zones, and metabolic insights instantly.
Powertest (Optional)
Boost accuracy to 95%% with an optional Powertest. Without Powertest: 90%% accuracy.
The Result: Our system continuously analyzes your training, providing precise insights into your performance development - fully automated, every day.
What You Get with Activity Analysis
Lab-grade metabolic insights from every training session
Carbs & Fats Consumption
Real-time metabolic analysis showing your fuel consumption during training. Optimize your nutrition strategy based on actual fat and carbohydrate usage.
VO2max Tracking
Precise measurement of your aerobic capacity from every training session. Track your endurance development automatically.
VLamax Analysis
Measure your anaerobic capacity - the only platform worldwide offering VLamax from regular training sessions.
Training Score & Body Reserve
Weekly analysis based on Mader's method to prevent overtraining and optimize recovery. Track your body's readiness.
Additional Features
Training Zones
Personalized zones based on your metabolism
GPS Maps
Color-coded route visualization
FTP & Critical Power
Automatic threshold calculation
Power Curves
Rolling week/month/year analysis
See EXACTLY Where Your Performance Varies
Color-coded GPS tracks show speed, power, temperature, cadence, and metabolic data directly on your route
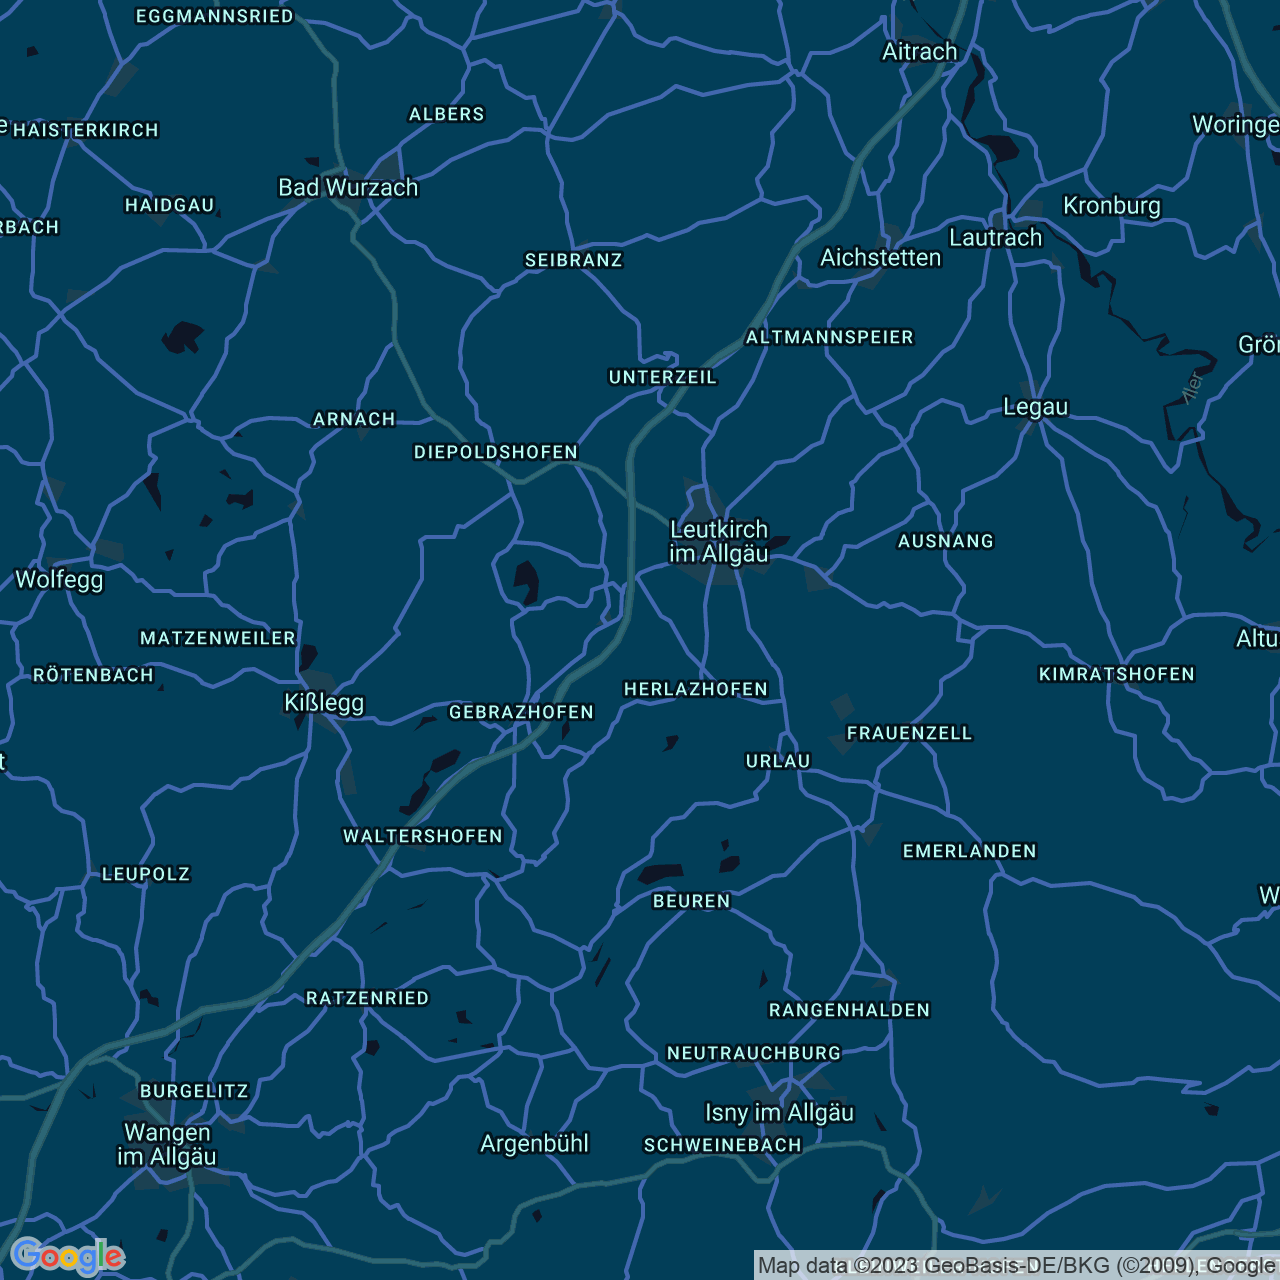
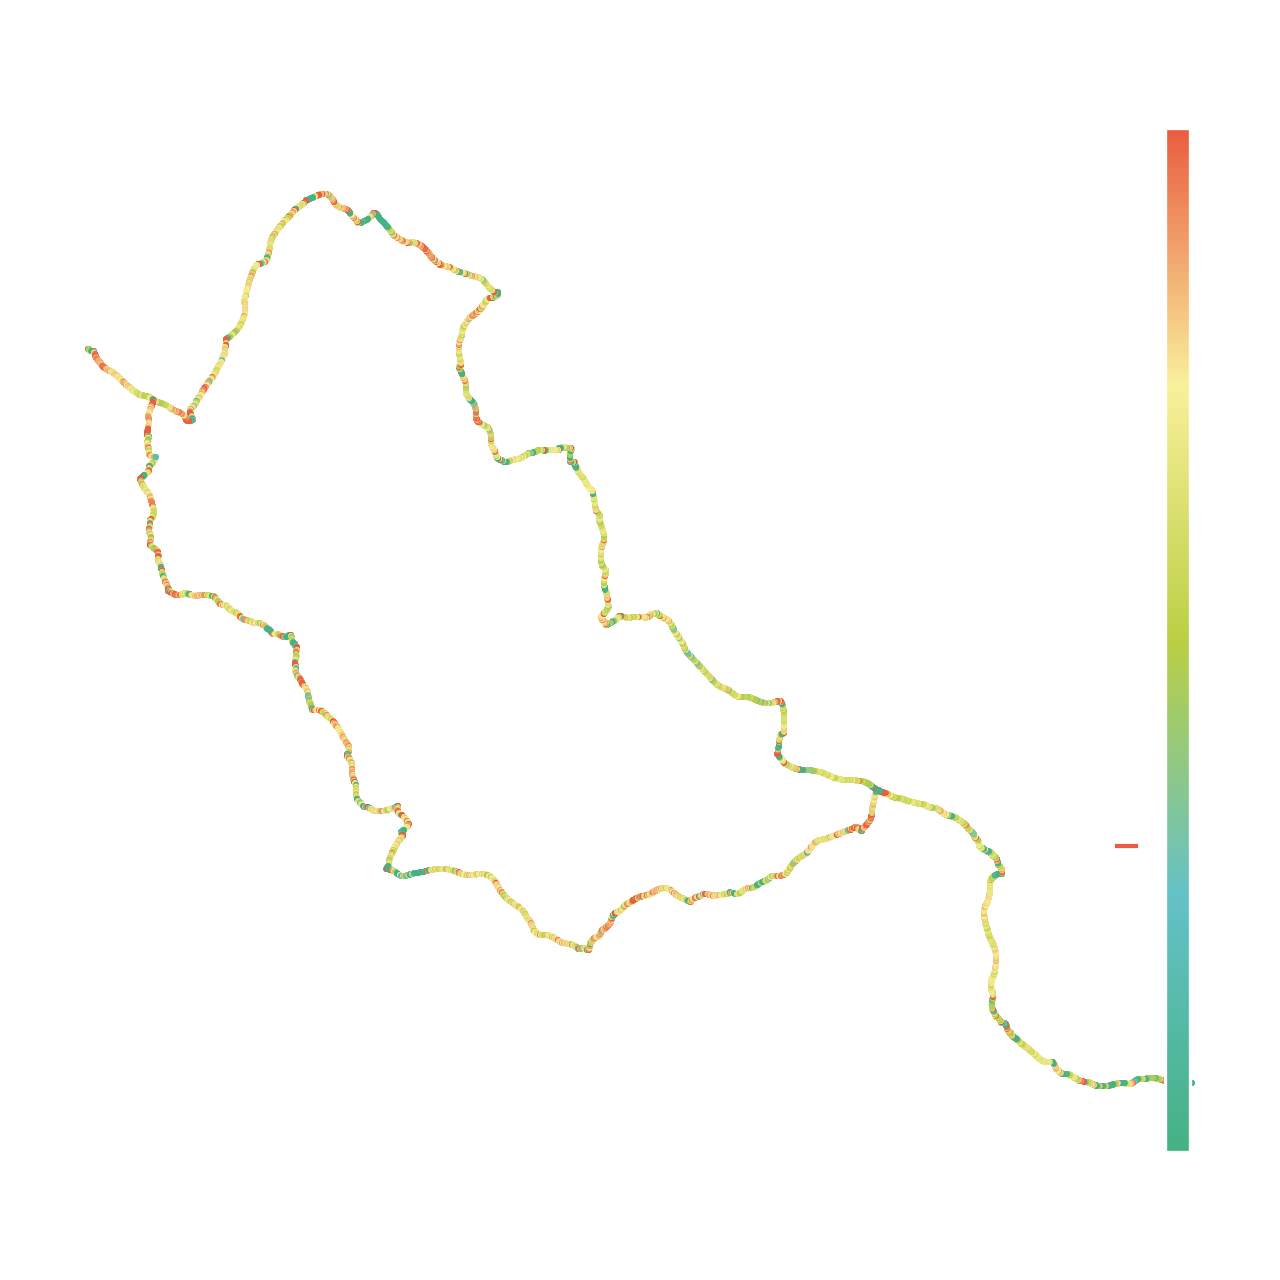
See Where Your Power Goes
Visualize your performance metrics directly on the map. Each segment shows where you invested power, maintained cadence, or consumed carbohydrates.
- Color-coded overlays for speed, power, and cadence
- Carbohydrate consumption mapped to your route
- Metabolic data overlaid on familiar training routes
Click the icons to switch between different metrics.
The Science Behind Activity Analysis
Trained on thousands of real athlete tests for lab-grade accuracy
10k+ Powertests
Trained on real athlete data from diverse sports and performance levels
90%% Accuracy
VO2max and VLamax predictions match laboratory measurements with 90%% accuracy
Continuously Improving
Our analysis system learns from every new test, constantly improving accuracy
Scientifically Validated
Based on Mader's method and validated against laboratory diagnostics
Analysis Pipeline
Data Collection
Power/Speed, Heart Rate, Duration
Smart Processing
Advanced analysis algorithms
Results
VO2max, VLamax, FTP, Zones
Your Weekly Overview
Comprehensive weekly summaries to track your training load and prevent overtraining
Smart Weekly Tracking
Training Load Management
Track your weekly training volume, intensity distribution, and cumulative stress to optimize performance.
Overtraining Prevention
If you exceed your training load, the excess is automatically carried over to the following week to ensure optimal recovery.
Weekly Trends
Visualize your progress week by week with comprehensive charts and performance indicators.
Recovery Monitoring
Track your recovery status and readiness for the next training block based on accumulated fatigue.
All weekly metrics are updated automatically as you complete your training sessions.
Pro Tip: Review your weekly summaries to identify patterns and adjust your training plan for continuous improvement.
What Do You Need?
Simple equipment requirements for accurate analysis
GPS Watch for Runners
Track your speed and distance
Power Meter for Cyclists
Measure your power output
Heart Rate Measurements
Essential for accurate analysis
20 Min of Training
Minimum duration for analysis
1 Second Recording
High resolution data capture
No Pause on Watch
Continuous data recording
Supported Platforms

Garmin Connect

Wahoo SYSTM
Manual Upload
Different Tools, Different Insights
Many athletes combine platforms. Here is what Activity Analysis adds.
| What Do You Learn? | Metabolic Analysis | FTP-based Tools | Coach Platforms | Activity Tracking |
|---|---|---|---|---|
| Your VO2max | Updated every workout | FTP-focused | Needs lab test | Basic estimate |
| Your VLamax (Sprint Capacity) | Included | Different focus | Different focus | Different focus |
| Carbs Burned Per Workout | Calculated from your metabolism | Different focus | Different focus | Calorie estimate |
| Training Zones | Based on YOUR metabolism | Based on FTP | Coach-defined | Heart rate only |
| Recovery Monitoring | Body Reserve system | Training load | TSS/CTL metrics | Relative effort |
| Weekly Summary | With metabolic insights | Training stats | Performance dashboard | Activity stats |
| Community & Social | Analysis-focused | Training-focused | Coach network | Large community |
| Best For | Understanding your physiology | Structured power training | Working with a coach | Logging and sharing rides |
Features evolve across all platforms. This reflects general approaches.
The key difference: insights into your metabolism, not just your power output.
Simple, Transparent Pricing
Activity Analysis is included in Premium - try free for 30 days
Metabolic Analysis
VO2max, VLamax, Carbs & Fats
Body Reserve
Overtraining prevention
90%% Lab Accuracy
95%% with Powertest
Success Begins with Activity Analysis
Join world-class athletes who trust Activity Analysis for their training
Andreas Seewald
#1 UCI WM MTB-MARATHON 21
#1 UEC EM Champion MTB-MARATHON 21
#2 UCI WM MTB-MARATHON 22
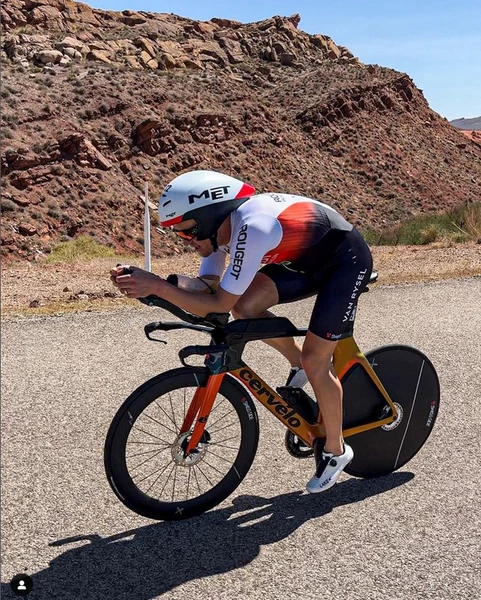
Denis Chevrot
#1 IRONMAN Europe 22
#1 IRONMAN Klagenfurt 2021
#1 IRONMAN 70.3 Varsovie

Laura Zimmermann
#1 IRONMAN Hamburg 2021
#3 IRONMAN Florida 2021
#2 IRONMAN Barcelona 2019
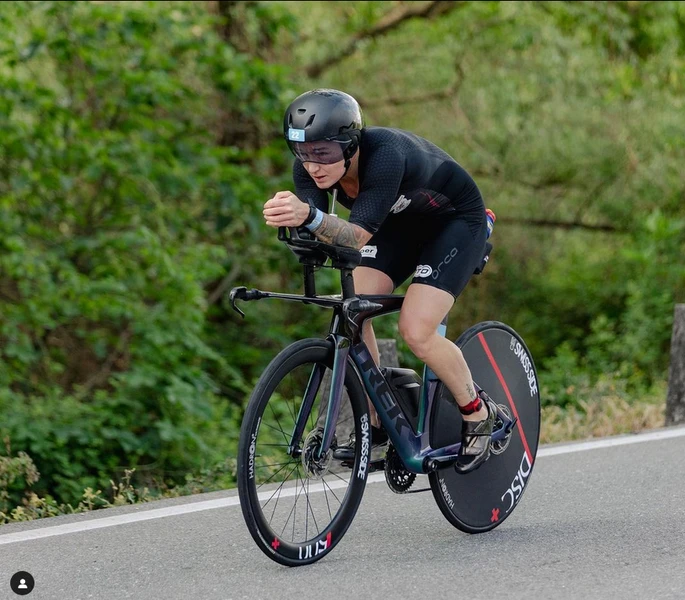
Katharina Grohmann
#2 IRONMAN Klagenfurt 2021
#2 German Championship LD 2019
#1 German Championship LD 2018
Markus Kaufmann
#1 Alpentour Trophy 2021
Join Them
Start optimizing your training with Activity Analysis today
Learn More in Our Podcast
Dive deeper into Activity Analysis and sports science

This will load content from Spotify.
By clicking, you agree to load content from Spotify. Privacy Policy
Discover how Activity Analysis revolutionizes training insights and helps athletes reach their peak performance.
Frequently Asked Questions
Everything you need to know about Activity Analysis
Ready to Unlock Your Metabolic Data?
Join thousands of athletes getting lab-grade VO2max, VLamax, and metabolic insights from every training session. Try free for 30 days.