Race Time Predictor: VO2max + VLamax to Every Distance (2026)
Your 10K time tells you a lot about your VO2max — and almost nothing about your marathon. Two numbers tell you both. Enter VO2max and VLamax (the rate your body produces lactate at a sprint) and a physics-based engine returns a finish time for every distance you race.
Why One Number Is Not Enough
The standard race-time calculator on every running site — Runner's World, McMillan, the various VDOT tools built on Jack Daniels' formulas — starts from a single input. You type in one recent race result, and the calculator extrapolates to all other distances using a fixed mathematical relationship. The output looks precise; underneath, it assumes you are an average runner with an average physiology.
Two athletes with the same 10K time, however, do not have the same marathon time. A sprinter type who can dig deep for 40 minutes will fade in the second half of any race longer than an hour. A diesel type who never has a top gear will hold pace for hours but never break 35 minutes in a 10K. The single-input model gives them the same prediction, and both predictions are wrong.
Our race-time engine is built on the Mader metabolic model (Mader 2003) and takes two inputs:
- VO2max — the maximum rate at which your body can deliver oxygen to working muscle, measured in ml/min/kg. It caps your aerobic ceiling.
- VLamax — the maximum rate at which your muscle produces lactate during a maximal sprint, measured in mmol/l/s. It describes how much of your VO2max you can actually use at long durations.
The two together fix the sustainable race pace at any distance from 1500 m to the marathon. Same engine that powers every A Faster You Powertest, same physics on every page of this site.
VO2max + VLamax → Your Race Time
Below is the predicted finish time for a 75 kg / 15% body-fat reference runner with a running-typical VLamax of 0.4 mmol/l/s. Gender barely changes the prediction (within 1-2%) at the same VO2max + VLamax combination; the well-known sex gap in race times comes from different typical VO2max ranges, not running economy. We will come back to that.
| VO2max ml/min/kg | 1500 m | 5K | 10K | Half marathon | Marathon |
|---|---|---|---|---|---|
| 42 | 7:29 min | 28:37 min | 1:05 h | 2:25 h | 4:55 h |
| 45 | 6:55 min | 26:27 min | 58:14 min | 2:11 h | 4:31 h |
| 48 | 6:26 min | 24:36 min | 52:46 min | 2:00 h | 4:10 h |
| 53 | 5:47 min | 22:05 min | 45:22 min | 1:45 h | 3:41 h |
| 56 | 5:28 min | 20:49 min | 42:47 min | 1:37 h | 3:27 h |
| 60 | 5:06 min | 19:22 min | 39:48 min | 1:29 h | 3:10 h |
| 64 | 4:47 min | 18:09 min | 37:16 min | 1:23 h | 2:56 h |
| 68 | 4:31 min | 17:05 min | 35:04 min | 1:17 h | 2:44 h |
| 72 | 4:17 min | 16:09 min | 33:10 min | 1:12 h | 2:34 h |
| 75 | 4:07 min | 15:32 min | 31:53 min | 1:09 h | 2:27 h |
These are potential times — the upper edge of what a fully tapered, well-paced runner with the listed VO2max can produce in race conditions. Most readers come within 2–4% of the table when their training matches a structured plan and pacing is competent.
Reverse Lookup: What VO2max Do You Need?
Most readers arrive with a target finish time, not a VO2max number. Below are the minimum VO2max values for popular target times, drawn from the same engine. New to VO2max? Start with the VO2max chart by age and gender →. Treat them as floors — a comfortable cushion is two or three points above.
5K targets
| Target | Minimum VO2max ml/min/kg | Pace at minimum |
|---|---|---|
| Sub-25 min | 48 | 4:55 /km |
| Sub-22 min | 54 | 4:19 /km |
| Sub-20 min | 59 | 3:56 /km |
| Sub-18 min | 65 | 3:34 /km |
| Sub-16 min | 73 | 3:11 /km |
10K targets
| Target | Minimum VO2max ml/min/kg | Pace at minimum |
|---|---|---|
| Sub-50 min | 50 | 4:58 /km |
| Sub-45 min | 54 | 4:26 /km |
| Sub-40 min | 60 | 3:58 /km |
| Sub-35 min | 69 | 3:27 /km |
| Sub-32 min | 75 | 3:11 /km |
Half-marathon targets
| Target | Minimum VO2max ml/min/kg | Pace at minimum |
|---|---|---|
| Sub-2:00 h | 48 | 5:40 /km |
| Sub-1:45 h | 53 | 4:57 /km |
| Sub-1:30 h | 60 | 4:14 /km |
| Sub-1:20 h | 68 | 3:47 /km |
| Sub-1:10 h | 75 | 3:16 /km |
For the deep dive on half-marathon pacing and a six-row reverse-lookup with cohort context, see Half Marathon VO2max →.
Marathon targets
| Target | Minimum VO2max ml/min/kg | Pace at minimum |
|---|---|---|
| Sub-4:30 h | 46 | 6:14 /km |
| Sub-4:00 h | 50 | 5:37 /km |
| Sub-3:30 h | 56 | 4:53 /km |
| Sub-3:00 h | 63 | 4:14 /km |
| Sub-2:45 h | 68 | 3:53 /km |
| Sub-2:30 h | 74 | 3:31 /km |
A note for runners staring at Sub-3 Marathon: a true 3:00 finish at VLamax 0.4 requires VO2max 63, not the lower number you see on most VDOT tools. Drop VLamax to 0.35 (the value of a well-trained marathon specialist) and VO2max 62 becomes enough. This is the second-engine effect that single-parameter calculators miss. For the full marathon deep-dive with cohort context, see Marathon VO2max →.
The 3-Third Pacing Protocol
Predicted time is upper-bound output. Pacing is what closes the gap. Our coaching default is a textbook negative split — break the race into three equal thirds and run each progressively faster, with the average pace from the table above as your middle third.
| Distance | First third | Middle third | Final third |
|---|---|---|---|
| 5K (Sub-20) | 4:02 /km | 3:56 /km | 3:50 /km |
| 10K (Sub-40) | 4:04 /km | 3:58 /km | 3:52 /km |
| HM (Sub-1:30) | 4:20 /km | 4:14 /km | 4:08 /km |
| Marathon (Sub-3:00) | 4:20 /km | 4:14 /km | 4:08 /km |
The kilometres are not the same between HM and Marathon despite identical paces — the third-segments are 7 km, 7 km and 7.1 km for the half, but 14 km, 14 km and 14.2 km for the marathon. The pacing logic is identical: open conservatively, hit average pace at the halfway gel, race the final block.
A note on shorter races: at 5K and 10K distances the effort distribution matters more than the second-deltas. Aim for "comfortable hard → hard → all-out" rather than literal pace targets, because the variation per kilometre at these intensities is large (5–8 s/km is normal).
Methodology: How the Engine Works
We do not aggregate other people's race times. Every prediction in this article is computed from first principles using Mader's metabolic model, which describes the energy supply at any exercise intensity as the sum of aerobic and anaerobic contributions. VO2max sets the maximum aerobic rate; VLamax sets the maximum anaerobic glycolytic rate. The sustainable pace at any duration is the highest one where the lactate-removal rate equals the lactate-production rate.
The same equations have been calibrated against 1,202 A Faster You athletes, 15,000+ Powertests and over 1 million analysed training sessions. When the model's predictions are compared to actual race results across our running cohort, the median error sits below 3% across all distances.
The biggest single source of remaining error is not the model — it is pacing variance on race day. Heat, gradient, crowds, and bridges can shift any prediction by 60–120 seconds in either direction.
One Table for Men and Women
The coaching convention is two tables and a "subtract 10% for women" rule. We tested that against our cohort. At the same VO2max and the same running VLamax, the predicted finish time differs by less than 1% between sexes across the 10K and half marathon, and by 1–2% across the marathon (with the male reference sometimes slightly slower at very high VO2max values). The well-known sex gap in finish times comes from different typical VO2max ranges, not from running economy at a given engine size.
Bring the engine, and the engine decides. The same table serves both sexes when both inputs are matched.
Estimate vs. Real Simulation
The interactive predictor on this page and the tables above run the Mader engine at population defaults — VLamax 0.4, typical running economy, and the assumption that you finish fully fueled. For most readers inside a structured plan, that lands within 2–4% of race day.
But a population model is not your model. Inside A Faster You, the race simulation runs on your own measured metabolic profile — your VO2max, your VLamax, your running economy, drawn from real sessions — not on an average runner. And it does something every public calculator ignores: it models carbohydrate availability. On a marathon the limiter is often not your engine but your glycogen — run the tank dry and your pace collapses regardless of how high your VO2max is. The platform simulates that fuel limit directly: it returns the pace your carbohydrate stores can actually sustain, and the grams-per-hour you need to hold it.
That is the difference between an estimate and a prediction. The table tells you what a runner with your VO2max could do on a good day. The simulation tells you what you can do, on your profile, fuel included.
How to Get the Inputs
You can plug guessed VO2max and VLamax values into the tables above and see how they affect your race-time predictions. To turn the calculator into a real planning tool, you need measured values. The fastest path is a Mader-model Powertest: a 15-second sprint plus a 12-minute all-out, recorded on any GPS watch with one-second data, returns both numbers in 25 minutes of testing.
Start a free trial of A Faster You and your first Powertest sets the baseline. From there, every interval, long run, and taper day in your plan is scheduled against your actual two-parameter profile — not against the assumption that you are an average runner.
FAQ
Is this better than Jack Daniels' VDOT? For the median runner the two systems land within a few percent of each other across the half-marathon and marathon. The differences appear at the edges of the rider-type spectrum: a high-VLamax sprinter beats their VDOT prediction at 5K and falls 4–8 minutes short at the marathon; a low-VLamax diesel does the opposite. VDOT is a strong one-parameter approximation. Adding VLamax catches the cases VDOT cannot.
What if I do not know my VLamax? Use 0.4 mmol/l/s as the running default — that is what the tables above are computed at, and it is the median value in our running cohort. If your races consistently fade in the second half relative to predictions, your VLamax is probably 0.45 or higher. If you can hold pace forever but never break a sub-18 5K, it is probably 0.30 or lower.
How do altitude and heat affect the predictions? Altitude costs roughly 6–8% of marathon time at 2,000 m, scaling roughly linearly. Heat (>22 °C) costs 30 seconds to several minutes depending on distance and humidity. The tables above assume sea level and 10–18 °C race-day conditions.
Can I use this for trail or ultramarathon races? The model is calibrated for road and track. Trail and ultra distances add running-economy variability (terrain, fatigue resistance, fueling discipline) that a metabolic-only model cannot resolve. Use the marathon row as the upper-bound prediction; expect real ultra times to scale by the typical road-to-trail ratios published per race.
Does the prediction work for half-marathon pacing too? Yes. For a focused half-marathon walkthrough with pacing per target time and a cohort-stratified table, the Half Marathon VO2max spoke → is the deep dive.
Why is my Powertest VO2max lower than my Garmin number? Watch-based estimates over-read for the untrained and recreational ranges by an average of 3 points in our cohort, and the inflation can reach 12 points for beginners. The Powertest is the reference; the watch is an inferred estimate that anchors on a population mean. For deeper detail, see our Garmin VO2max accuracy report (coming soon).
Why not use a cycling test for running predictions? VO2max transfers across modes with a typical 10–15% reduction from cycling to running for an athlete who trains both. VLamax does not transfer cleanly — the values are sport-specific because they depend on the recruited muscle mass. If you race running, test running. The running Powertest protocol → (with one-second recording enabled) is the right starting point.
What This Pillar Replaces
Most readers arrive at this page because a VDOT calculator gave them a number they did not trust. The Mader-engine prediction above is the higher-fidelity reference: two inputs instead of one, a physics-grounded engine instead of a statistical extrapolation, and a methodology box you can read. It will not predict your trail ultra. It will tell you, with under-3% median error in our cohort, what you can run on a flat road at sea level in cool conditions, for any of the five distances that own the road racing calendar.
Set the target time. Find the VO2max it requires. Test where you sit today. Train the gap. Race the plan.
Sources: Mader, A. (2003) — Glycolysis and oxidative phosphorylation as a function of cytosolic phosphorylation state and power output of the muscle cell. Eur J Appl Physiol, 88(4–5), 317–338. Mader, A. & Heck, H. (1986) — A theory of the metabolic origin of the "anaerobic threshold". Int J Sports Med, 7 Suppl 1, 45–65. Bassett, D.R. & Howley, E.T. (2000) — Limiting factors for maximum oxygen uptake and determinants of endurance performance. Med Sci Sports Exerc, 32(1), 70–84. Billat, V. (2001) — Interval training for performance: a scientific and empirical practice. Sports Medicine, 31(1), 13–31. Daniels, J. (2014) — Daniels' Running Formula, 3rd Ed. (referenced for VDOT comparison). Mader-model cohort: 1,202 A Faster You athletes, 15,000+ Powertests, 1M+ analysed training sessions (2026 baseline).
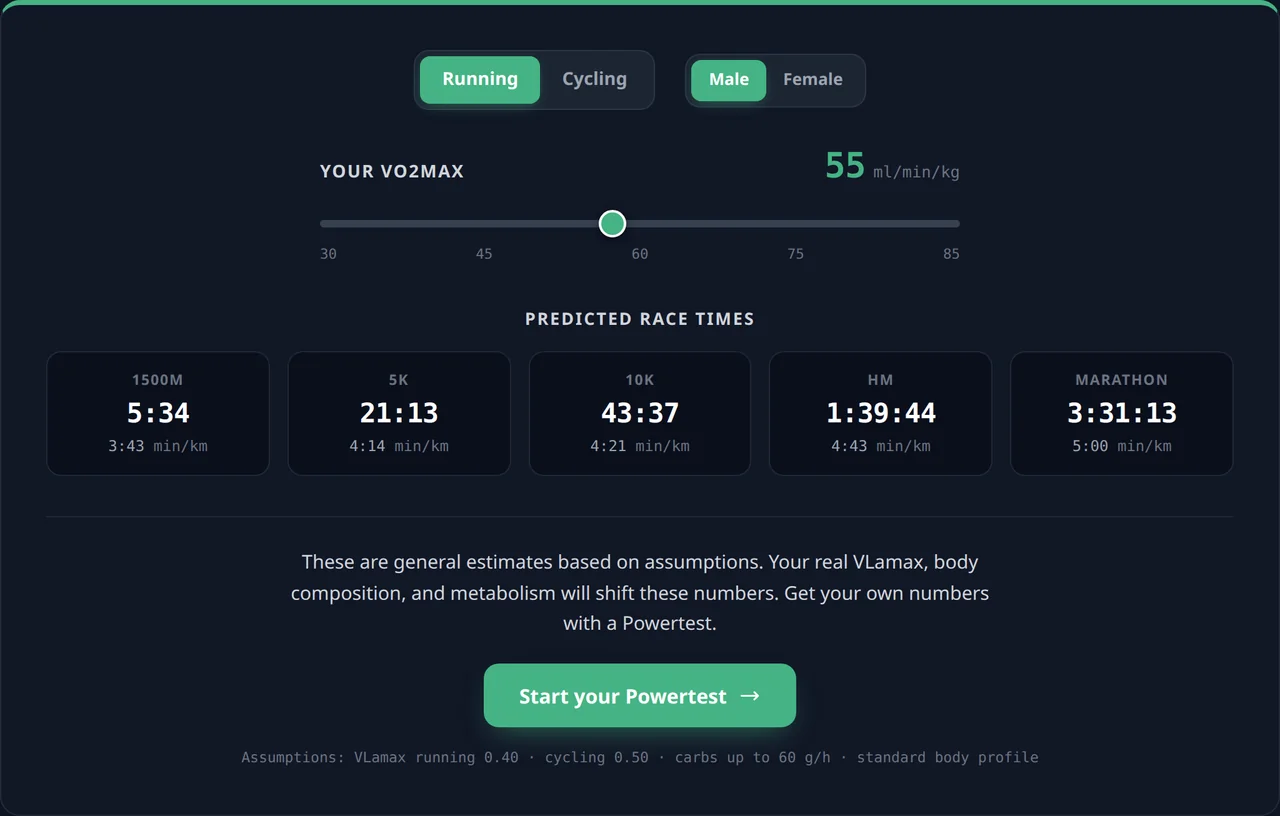
Your VO2max in Real Race Numbers
Pick your sport, your VO2max, and see what it translates to — based on the Mader metabolic model.