Garmin VO2max Accuracy: How Close It Gets (108 Paired Powertests, 2026)
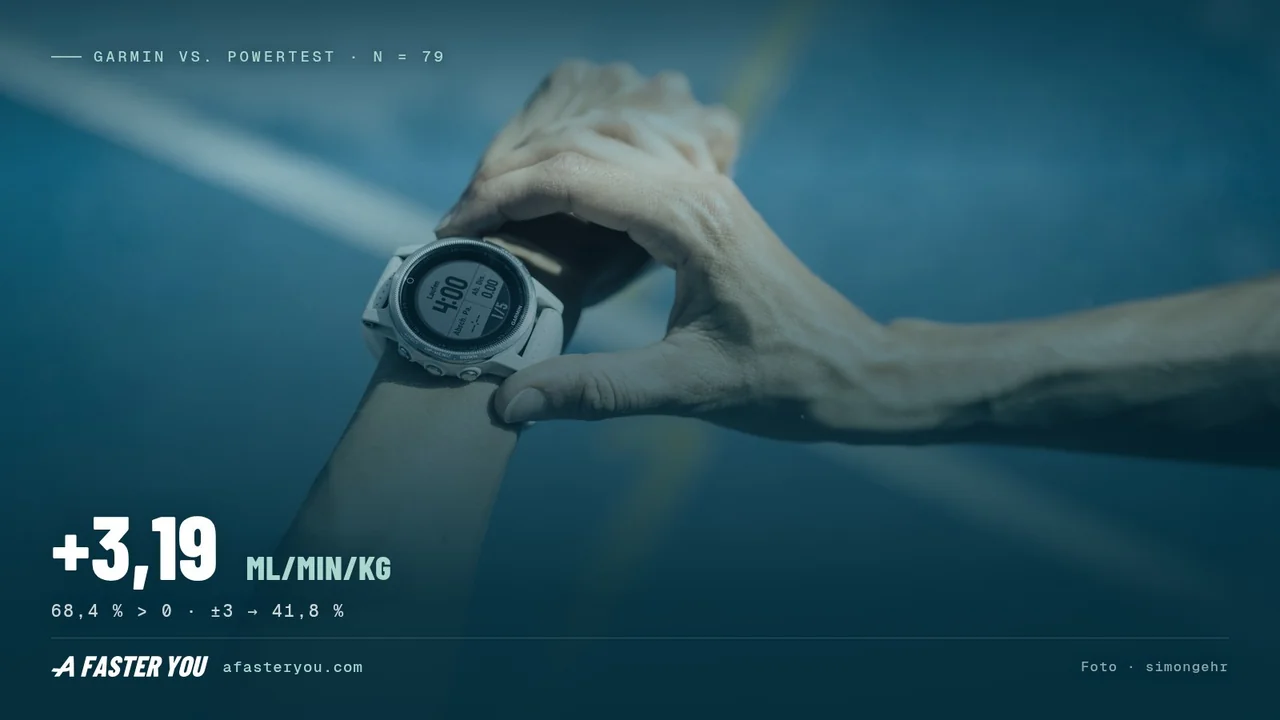
Your Garmin says 52. Is it right? In 108 cases where we could hold Garmin's own VO2max number against a measured Powertest, the watch read just under three points high on average — and how close it lands depends on how fit you already are.
What Garmin Actually Measures
Modern Garmin watches do not measure VO2max in the lab-physiology sense. They estimate it from the relationship between heart rate and pace (or power on a cycling computer) during your everyday rides and runs. The algorithm comes from Firstbeat Analytics, Garmin's own physiology team, and looks for sub-maximal data points and projects forward to what your maximum oxygen uptake would be if you pushed all the way to exhaustion.
It is a remarkable piece of engineering: a free, always-on estimate that needs no test at all. Like every estimate, it carries a bias. The question for any athlete reading a number on the wrist is: how big is the bias in my fitness range, and which direction does it pull?
How We Tested It
A Mader-model Powertest measures both VO2max and VLamax directly from a short maximal protocol. It is a field test on your own bike — no mask, no treadmill, no appointment — and it is the reference every figure in this article is measured against.
A reference is only worth as much as its own evidence. So we held the Powertest itself against lab spirometry: across 43 lab-validated athletes the mean bias is −1.8 ml/min/kg — read the full validation here.
For this comparison we applied the strictest standard our database allows:
| Step | Tests | Why |
|---|---|---|
| Powertests on the platform | 15,000+ | the data base |
| of those, at test quality | almost 9,000 | only tests that completed the protocol fully and without anomalies — internal test accounts and aborted recordings excluded |
| with a close-in-time Garmin value on the bike | 108 | a Garmin VO2max for the same athlete, no more than 90 days from the test — close enough that no meaningful fitness change sits in between |
Those 108 observations come from 95 athletes. That is the source, stated plainly — Garmin's number, not our model's estimate of it. We compare bike against bike only: Garmin keeps running and cycling values separate, and a Powertest ridden on the bike belongs against the cycling number.
We are not claiming "15,000 watch comparisons". We are claiming 108. Where a fitness bucket rests on only a handful of athletes, you will find the count in the table rather than buried in an average. As of August 2026.
The Headline Numbers
| Metric | Value |
|---|---|
| Paired observations | 108 |
| Mean bias (Garmin − Powertest) | +2.91 points |
| Spread of that bias (SD) | 5.29 points |
| Mean absolute error | 4.65 points |
| Correlation with the Powertest (r) | 0.813 |
| Best-fit line | Garmin = 0.732 × Powertest + 18.02 |
| Where the two agree | VO2max 67.2 |
Two numbers carry this article. The first is the bias: on average Garmin reads just under three points high, and the correlation of 0.813 says it does track real fitness — this is a good estimator, not a random number generator.
The second number is the one that actually matters. The slope is 0.732, not 1.0. A watch that followed the measurement one for one would sit at 1. At 0.732 every value gets pulled toward the middle: low readings come out too high, high readings too low. The two lines cross at 67.2. Below that, Garmin tends to read higher; above it, a touch lower.
The Bias Curve — And Why It Flips
The most useful view of this data is the bias broken out by fitness bucket. It shrinks from bottom to top, and at the elite end it reaches zero.
| Powertest VO2max bucket | n | Powertest avg | Garmin avg | Bias (Garmin − PT) |
|---|---|---|---|---|
| <45 (untrained) | 9 | 41.6 | 50.2 | +8.67 |
| 45–55 (recreational) | 42 | 50.2 | 54.4 | +4.04 |
| 55–65 (trained) | 40 | 59.9 | 61.3 | +1.41 |
| 65+ (elite) | 17 | 70.7 | 70.9 | +0.21 |
Read the n column first. The untrained bucket rests on nine athletes. That is an order of magnitude, not a precise figure — take it as "roughly eight to nine points too high" and nothing sharper. The two middle buckets carry about 40 athletes each, and those you can lean on.
Now read from top to bottom. An untrained rider whose measured VO2max is 42 sees about 50 on the wrist. A recreational rider at 50 sees 54. A trained rider at 60 sees 61. And an athlete at 71 sees 70.9 — that is a direct hit, two tenths apart.
So the headline is not that Garmin goes soft on elite athletes. It is the reverse: Garmin is accurate at the top and generous at the bottom. The fitter you get, the closer your watch lands on the measured value.
Why Regression Toward the Mean Explains This
This is the textbook signature of an estimator anchored on a population prior — and in this data it is no longer a hypothesis. It is measured. The best-fit line has a slope of 0.732: one point of real, measured VO2max shows up as just under three quarters of a point on your wrist. The algorithm carries a built-in expectation of what a normal VO2max looks like, and whenever your submaximal heart-rate-to-power data leaves room for interpretation, it pulls your value toward that expectation.
That compression is exactly why the crossing point matters. At a true VO2max of about 67, the watch is right — not by luck, but by construction. Below it the estimate leans high, above it slightly low, and the further you sit from 67 in either direction, the wider the gap.
How to Interpret Your Garmin Number
Here is how to read your Garmin number in context, no math needed:
| Self-assessment | Garmin typically reads | What to do with it |
|---|---|---|
| New to structured training, mostly easy rides | around 50 | Subtract 8–9 points (thin data, n=9) |
| Recreational, some intervals, 4–6 h/week | around 54 | Subtract 4 points |
| Trained, structured plan, racing | around 61 | Subtract 1–2 points |
| Elite or near-elite, frequent racing | around 71 | Trust it — it is already right |
This is not a substitute for a measurement, it is a sanity check. The corrections are central tendencies for our cohort, and the individual scatter around them is large: the standard deviation of the bias across all 108 pairs is 5.29 points, the mean absolute error 4.65. Read the table as "your true value is probably in this region", never as "your true value is exactly this".
Once you have landed on a likely true number, see where it ranks for your age and sex on the VO2max chart by age — that context tells you whether to keep chasing or hold what you have built.
What About Apple Watch and Polar?
We do not yet have a paired comparison cohort for non-Garmin watches at the same level of methodological rigour. From the published literature and the broader VO2max-watch comparison work that does exist:
Apple Watch uses a similar HR-and-pace inference (built on the Sports Science team's own model rather than Firstbeat). Independent research reports errors of a similar order. In the 2025 PLOS ONE validation (Series 9 and Ultra 2, a very fit sample) the Apple Watch read about 6 points low on average — the same pull toward the population middle described above, seen from the top end (Apple Watch VO2max accuracy).
Polar works on the same heart-rate principle. We have no paired Polar data of our own, so we draw no conclusion about its direction here.
The summary: Garmin in our data and the Apple Watch in that lab sample show the same pattern — a pull toward the population middle that comes with HR-based VO2max estimation in general, not with any one brand. And both deliver a valuable number without a single test.
From a Strong Estimate to an Exact Measurement
Your Garmin already gives you a strong estimate without a single test. If you build zones, fuelling and a plan on that number, the next step is to measure it — no correction table needed.
Here is the part most people miss: the rides you already upload to Garmin hold the data to do it. Connect your Garmin to A Faster You and we read those existing sessions to place your real VO2max — the two-engine version: VO2max plus VLamax, the second engine that a heart-rate estimate isn't designed to capture — then build a plan that adapts to each session to raise it. No lab, no bias-curve lookup, and a coach that tells you why your numbers move, not just that they did.
Connect your Garmin and see your real number →
Want the measured version on top of the estimate? The Mader-model Powertest packs about 25 minutes of efforts (10 s + 4 min + 12 min plus recoveries) into a 1.5–2.5 h session including warm-up on your own bike, and pins your VO2max and VLamax exactly — it is the reference behind every figure in this article. Most A Faster You athletes run their first in week one, then re-test at least once a year — more often is better: run a Powertest →
Once you have your number, see where it ranks for your age and sex — and what race times it predicts — in our VO2max chart by age →. For what "trained" looks like across distances and rider types, our larger cohort report compares 3,384 athletes to ACSM norms: VO2max & VLamax cohort report →
FAQ
Why does my Garmin VO2max change by 2 points day to day? The estimator updates after every aerobic activity, and the underlying HR-to-pace relationship is noisy: caffeine, sleep, ambient temperature, and hydration all shift it by a few percent. Trust the 28-day trend, not any single day. The day-to-day jitter is normal and is not a sign that your fitness genuinely fluctuated.
Is the watch number reliable as a trend, even if the absolute value is off? Mostly yes. The bias direction tends to be consistent for a given athlete over months, so a watch-reported increase from 50 to 53 generally reflects a real fitness gain, even if your true VO2max is closer to 46 throughout. Treat the trajectory as a signal; treat the absolute number as a rough anchor.
Does running vs. cycling matter for the watch number? Far less than most people assume. We checked the 720 athletes for whom Garmin reports both a running and a cycling VO2max: in 87.8% of them the two numbers are identical. The watch is not running two separate models — for the large majority it publishes one number under two labels. So if you were hoping the running figure would settle the argument, it is usually the same figure.
My Garmin says 60 but my Powertest came back 50. Which should I believe? Use both — they answer different questions. The Powertest is a measurement, so it is the anchor for your zones; your Garmin is a strong estimate from heart rate that keeps tracking your trend every day. In our 108 paired comparisons Garmin lands almost exactly on the measured value for trained and elite athletes and tends to read higher below that. A 10-point gap is at the far end of what we see: for a recreational rider the typical gap is about 4 points, and individual pairs scatter by about 5 around that.
Will my Garmin number get more accurate if I do more rides? Slightly, yes — the algorithm benefits from more sub-maximal data points and from heart-rate samples close to threshold. The pull toward the population middle stays, though — that comes with any estimate from submaximal data, not with how much you ride.
Does training to push my VO2max up actually move the watch number? Yes, in the same direction, but compressed. With a slope of 0.732, three real points (Powertest +3) show up as a little over two watch points. Plan from the Powertest delta, not the watch delta.
Are the watch VO2max numbers safe to share with a coach? For broad context, yes. For prescribing training zones, a measured value is the better anchor: zones need a precision that no estimate from everyday sessions is designed to deliver.
Sources: Mader, A. (2003) — Glycolysis and oxidative phosphorylation as a function of cytosolic phosphorylation state and power output of the muscle cell. Eur J Appl Physiol, 88(4–5), 317–338. Mader, A. & Heck, H. (1986) — A theory of the metabolic origin of the "anaerobic threshold". Int J Sports Med, 7 Suppl 1, 45–65. Bassett, D.R. & Howley, E.T. (2000) — Limiting factors for maximum oxygen uptake. Med Sci Sports Exerc, 32(1), 70–84. FirstBeat Technologies — Automated Fitness Level (VO2max) Estimation with Heart Rate and Speed Data (white paper, 2014, updated 2019). Cohort: 108 bike-paired Garmin-reported VO2max observations (±90-day window), selected from over 15,000 Powertests in the A Faster You database by the standard described above. As of August 2026.