How Accurate Is a Power-Based VO2max Test? Validation Against Lab Spirometry in 43 Athletes
Your watch says 52. A lab test last spring said 49. Your training platform shows 54. Same body, three numbers — so when we tell you your VO2max, how do we know it's right?
Fair question. We went and answered it the only way that counts: we put our own Powertest up against the gold standard — spiroergometry, the mask-on-your-face lab test. This article is the full result. Every number, including the uncomfortable ones.
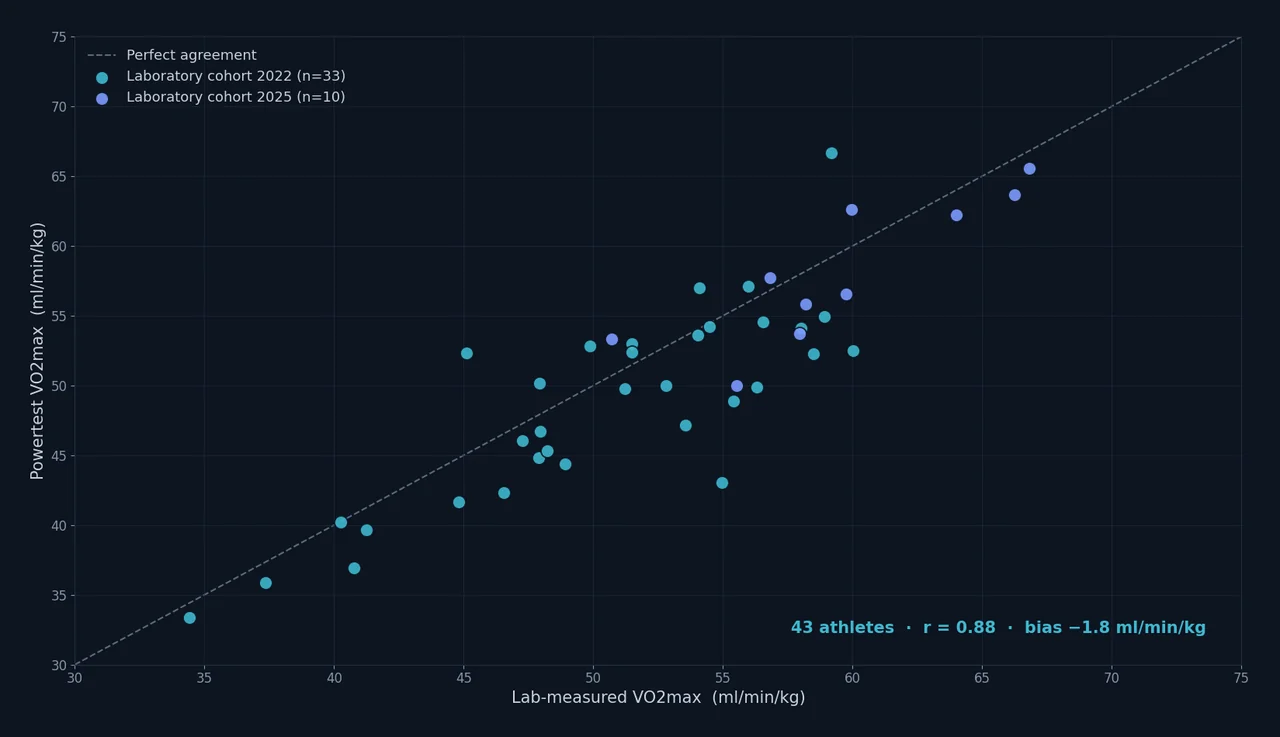
The short version: Across 43 lab-validated athletes, the mean bias of our power-based VO2max against the lab is −1.8 ml/min/kg, and the mean absolute single-test difference is 3.3 ml/min/kg. And the part most people miss: even when the VO2max label is off, your training zones barely move — we computed why, and we'll show you.
What the Powertest actually measures
The Powertest is one ride: a short all-out sprint, a ramp to exhaustion, and a 12-minute block. From the watts you produce, the Mader metabolic model computes your engine: critical power, W', VO2max, VLamax, FatMax, and all training zones.
Notice the order there. The Powertest measures watts first — what you actually push into the pedals, with the power meter you train with. VO2max, in our system, is a derived quantity: your aerobic power expressed in the lab's units of oxygen, using the constant our model applies: roughly 11.4 ml of oxygen per minute per watt.
That one conversion factor is where most of the label uncertainty lives — and because it is a single, explicit assumption, the accuracy question becomes answerable. And honest.
How we validated it
Methodology: How We Built This Comparison
Our platform holds over 15,000 Powertests from more than 1,000 athletes. But validating VO2max needs something rare: the same athlete, measured by both our test and a metabolic cart.
Our data was collected as part of a joint research project with MSH Medical School Hamburg: two separate laboratory cohorts (2022 and 2025) rode ramp tests on lab ergometers with Cosmed metabolic carts at the university's exercise-science laboratory. After matching power and breathing signals under predefined criteria, the 2022 cohort yielded 33 verifiable power-spirometry pairings and the 2025 cohort 10 — 43 in total, one test per athlete. Tests where the signals could not be verifiably matched were excluded, with reasons documented; exclusions went both directions, so nothing was cherry-picked.
For every test, only time, power, and heart rate went into our production pipeline — the oxygen data was deliberately withheld, so the model could never peek at the answer. The lab reference is the highest 30-second average of measured VO2 (formally a VO2peak criterion; the lab protocols did not include separate verification bouts).
The 43 athletes range from recreational riders at 34 ml/min/kg to trained athletes at 67. Both sexes are represented, though the cohorts skew male — a limitation worth naming, even if the wattage chain of the model carries no gender term. The joint research program with MSH is ongoing; a scientific publication is planned as the cohorts grow. Data as of August 2026, powertest engine v1.8.1.
The result
| Metric | Value |
|---|---|
| Bias (Powertest − lab VO2peak) | −1.8 ml/min/kg [95% CI −2.9 to −0.6] |
| Mean absolute error (MAE) | 3.3 ml/min/kg (6.2%) |
| Correlation (Pearson r) | 0.88 |
| 95% limits of agreement | −9.1 to +5.5 ml/min/kg |
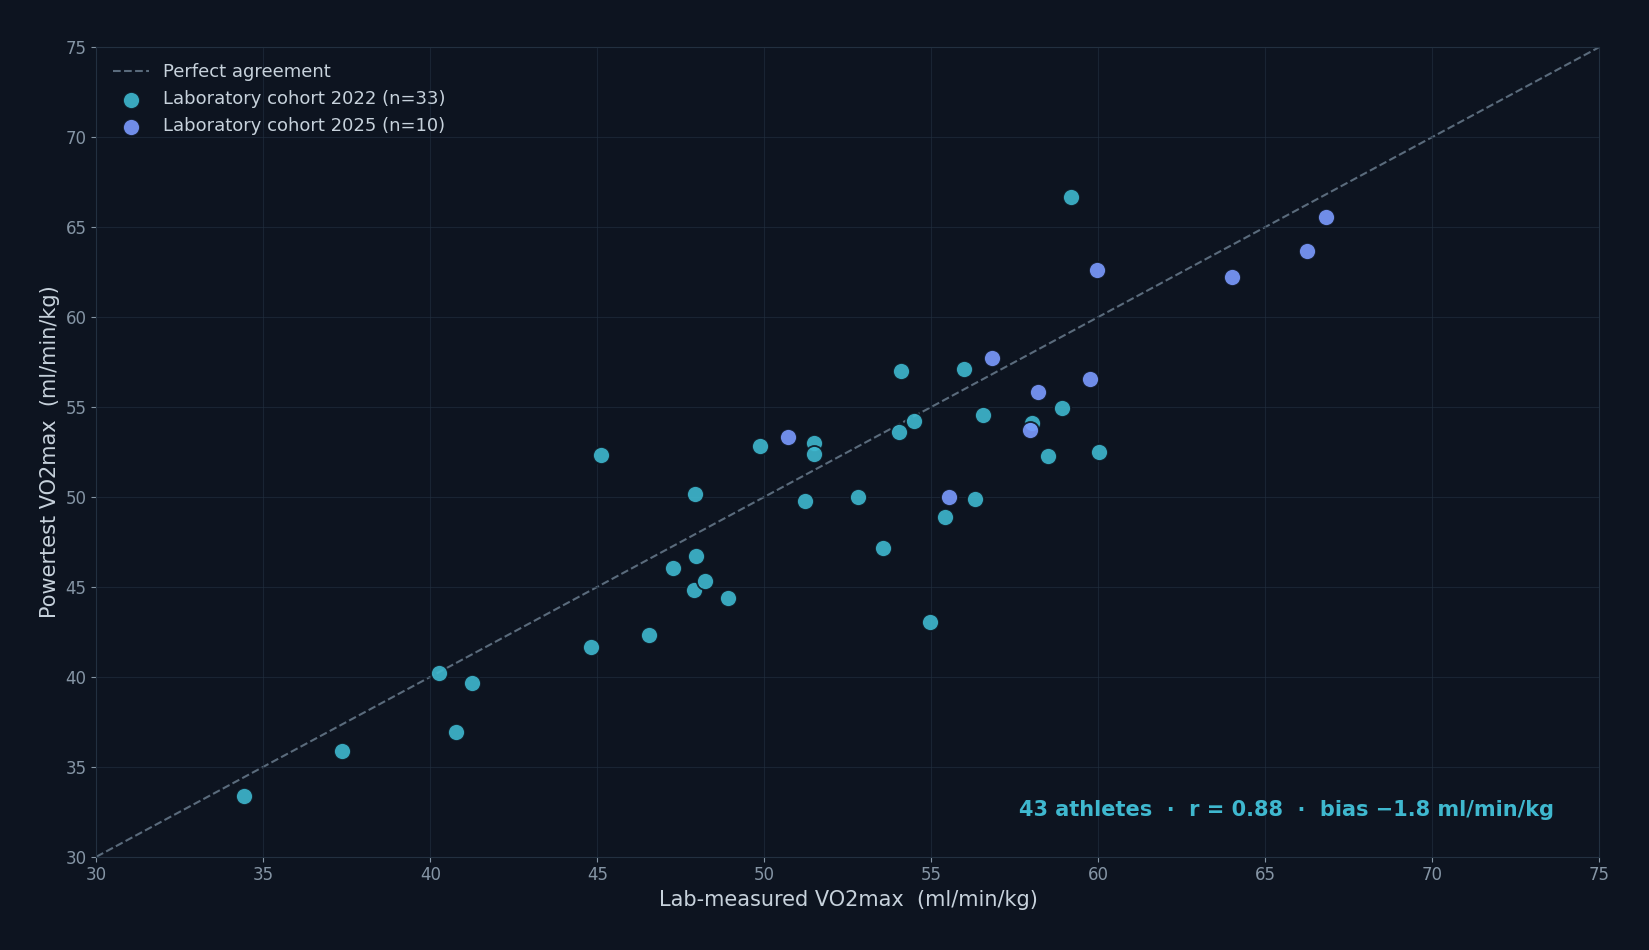
In plain language: on average we read just under two points conservative — that's the bias. The difference for an individual test is larger — the mean absolute difference was 3.3 ml/min/kg — and the 95% limits of agreement span −9.1 to +5.5 ml/min/kg.
Is that good? Context helps. Wrist-based estimates do impressively well from everyday heart rate and pace, with no test at all; that path also carries heart rate, terrain and running style. We've measured Garmin's VO2max against our own Powertests (108 pairs) and summarised the independent research on the Apple Watch. And the lab reference itself is not a perfect ruler: repeat spirometry on the same athlete varies from visit to visit as well — the lab is a reference, not an oracle.
And if you want to know what your own number means in context: the VO2max chart by age and gender places it, and the cohort reference values from 3,384 athletes show where trained athletes actually land.
Everything from one ride
The Powertest gets its numbers from one guided ride: sprint, ramp and a 12-minute block in a single session, which returns CP, W', the VO2max and VLamax labels, FatMax and your zones. In the subgroup of trained male cyclists on the ramp protocol (n = 10), the bias against the lab was −1.5 ml/min/kg (95% CI −3.5 to +0.5), in line with the pooled 43 athletes (−1.8).
The one error term — and we measured it in all 43 athletes
Here is the structurally honest part. Our model has exactly one tunable conversion assumption: watts to oxygen. The rest of the chain runs on measured watts — which still leaves the usual real-world sources (test execution, device behavior, model fit, and the reference measurement itself), but no second hidden model constant. When we decomposed the disagreement athlete by athlete, variation in the effective oxygen-per-watt ratio accounted for most of it.
So how much does that ratio vary between real athletes? Across all 43 lab-validated athletes: from 8.8 to 13.2 ml/min/W; 68% of athletes sit within ±7% of the population value of 11.4 that we use.
Two things hide inside that spread, and a single paired test cannot separate them. An athlete showing 13 ml per watt might genuinely be less economical — or their power meter might read 10% low. Both look identical in the data. We quantified the device part from our own platform: among 790 dual-recorded device pairings, the typical (standard-deviation) disagreement between two power sources is about 2.4%, with outliers beyond 10%. That explains only a small part of the observed economy spread — the rest sits with the athlete and the measurement chain, and these data cannot split that remainder cleanly.
Why does this matter to you? Because of what comes next.
Why your training zones don't care about any of this
This is the core property of a power-based system, and we can state it as a computed fact, not a claim. We took a fixed set of measured watts and ran our full calculation while sweeping the oxygen conversion factor by ±9% — slightly wider than the empirical two-thirds corridor of ±7%:
| Quantity | Change across the ±9% economy sweep |
|---|---|
| Threshold power | 0.0% |
| W' (anaerobic capacity) | 0.0% |
| Training zone boundaries (Recovery to VO2max) | at most 1.4% (5 W), most exactly 0.0% |
| FatMax power | 0.3% |
| VO2max label in ml/min/kg | ±9% (18% total range) |
| VLamax label | ±9.5% (19% total range) |
Read that top half again. Threshold and W' are exactly invariant; every zone boundary moves by five watts at most — while the physiological labels track the conversion factor one-to-one, spanning nearly a fifth from end to end. The factor scales the labels, not the watts. An athlete with an unusual economy, or a power meter that reads a few percent off, still gets essentially the same zones (at most 5 W of movement) — this source of uncertainty barely reaches them, because the zones are computed from, and executed with, the same watts on the same device. (Invariance to this factor is not by itself proof that the zones are physiologically ideal — that case rests on the metabolic model and its validation — but it removes the largest suspected error source from your day-to-day training targets.)
That's the difference between a lab-oriented and a performance-oriented system. The lab measures your oxygen. We measure what you put into the pedals — and your training happens in watts, not in milliliters of oxygen.
The same logic makes change over time a strong discipline of a watts-based system. Your power meter is the same device month after month, so a stable device bias drops out of the trend. And economy? Here's the objection we hear from lab diagnosticians: "athletes vary in economy, and economy itself can change." In a watts-based system, that's not a flaw — it's the point. Whether your watts improved because your aerobic engine grew or because you became more economical, the watts you gained are real, and watts are the currency your race results are paid in. To be precise about what that means: the performance change is directly measured; splitting it between "bigger engine" and "better efficiency" would need gas-exchange measurement, which no power-based system can do. A lab can make that attribution — but outside of technique, position and equipment work, there is no separate training prescription for economy, so in day-to-day coaching the split rarely changes a single decision. The Powertest measures the sum that wins races.
This is exactly what your zones in A Faster You are built on — every plan, every workout target, every pacing recommendation runs on these watts.
What about fueling? We did the math
One place the economy assumption does reach: carbohydrate calculations, because burned energy scales with oxygen, not with watts. So we computed the error for every one of the 43 lab athletes from their actually measured economy:
| Share of athletes | Race-pace carb burn error (at 164 g/h) | FatMax-ride error (at 50 g/h) |
|---|---|---|
| 50% | within ±7.9 g/h | within ±2.4 g/h |
| 68% | within ±11.4 g/h | within ±3.5 g/h |
| 85% | within ±15.5 g/h | within ±4.7 g/h |
For two out of three athletes, the race-day carb-burn error is half an energy gel per hour or less. Race fueling plans typically work in coarse intake steps anyway, and intake is capped by what your gut absorbs. If you belong to the minority with a strongly atypical economy, a real spirometry adds precision — and if you have lab data, you can enter it and our system uses your personal value from then on.
The number the lab doesn't give you
Here's what gets lost in every "field test vs. lab" debate. A standard CPET is genuinely rich: VO2max, ventilatory thresholds, gas-exchange and cardiopulmonary data. What it does not give you is VLamax — the glycolytic side of your engine, the number that separates the diesel from the sprinter and decides how your threshold responds to training. Determining it takes a dedicated sprint protocol, usually with post-exercise lactate sampling.
Your Powertest computes VLamax from the same single ride as everything else, because the model jointly fits the sprint, the ramp, and the 12-minute block. And the system is calibrated as one coherent whole: the ramp evaluation is anchored so that the population lands on a mean VLamax of about 0.5 — the calibration anchor we also use in our lactate-based testing. One ride, both sides of your engine, plus the zones to train them.
If you want to understand what that second number does to your racing, read our deep dive on VLamax vs. VO2max.
Where we're honest about the limits
Plateau athletes. Some athletes keep producing watts after their oxygen uptake has flattened — a true VO2 plateau. A pure ramp evaluation overestimates VO2max in that case, because the final watts are anaerobic, not aerobic. Our full protocol dampens this — the 12-minute block anchors the sustainable side — and we're building plateau detection into the test quality score.
Why we don't simply subtract the bias. The obvious question: if we measure −1.8 against the lab, why not add 1.8 and call it zero? Because tuning the model to the same 43 athletes we validate on would turn an independent validation into curve fitting — a correction deserves to exist only once a new cohort confirms it. The conservative bias and the plateau overestimation also pull in opposite directions — a global shift would make plateau athletes worse, so we'd rather fix the specific mechanism than move everyone. The system stays calibrated to its internal physiological anchors; the validation stays a test, not a training set.
Running. Everything above is cycling. Running adds a second uncertainty — the power model itself — and our running validation (31 treadmill sessions with parallel spirometry and Stryd power) shows a preliminary overestimation of about 6 ml/min/kg — an internal result we consider not yet publication-ready. We're working with individual running-economy determination before we put a number on running accuracy. When we can defend it, you'll read it here first.
The individual corridor is real. A bias near zero doesn't mean every test is near zero. Under the usual distributional assumptions, about one test in twenty is expected to fall outside the −9 to +6 ml/min/kg corridor. If your absolute VO2max matters medically or professionally, a spirometry remains the reference — and slots straight into your profile.
What this means for you
If you've been treating your VO2max number as a fuzzy estimate because "it's not a lab test" — the data says otherwise. Its average bias against the lab is under two points, deliberately reported rather than tuned away, and a typical single test sits within three to four. Your zones run on the one currency this uncertainty cannot reach: your measured watts (how those zones come out of the Mader model). You can retest at a cadence and consistency no annual lab visit offers. And you get VLamax included, which a standard lab test doesn't determine at all.
There's also the practical math: a lab spirometry typically costs 150 to 300 euros per visit in Germany (our market check, August 2026), needs an appointment and a trip — and doesn't determine VLamax. A Powertest is one ride from home, as often as your training plan wants one.
Ready to measure your engine? Start your free trial and ride your first Powertest this week — one ride, your power-based metabolic profile.
FAQ
How accurate is the Powertest VO2max compared to a lab test? Across 43 lab-validated athletes, the mean bias is −1.8 ml/min/kg and the typical single-test error is 3.3 ml/min/kg (about 6%), with 95% limits of agreement of −9.1 to +5.5.
Why does my smartwatch show a different VO2max? Watches do impressively well estimating VO2max from everyday heart rate and pace, with no test at all; that path also carries your heart-rate response, terrain, and running style. A power-based test measures mechanical output directly and converts it with a validated metabolic model — a more direct path when you need precision. We've paired Garmin's estimate with our own Powertests and summarised the independent Apple Watch research: see our Garmin and Apple Watch analyses.
If the oxygen conversion is wrong for me, are my zones wrong? This source of uncertainty doesn't reach them — and that is computed, not claimed. Threshold and W' depend only on your measured watts and stay exactly unchanged; zone boundaries move by at most 1.4% (5 W) across the full realistic economy range. Only the VO2max and VLamax labels scale with the conversion factor.
Can a power meter with bad calibration ruin my test? It shifts your VO2max label (a 5% miscalibration shifts the label by about 5% — we verified the proportionality directly), but not your zones — you train and test on the same device, so a stable, proportional device bias cancels where it matters (drift, nonlinear error or switching devices does not). Between-device disagreement across 790 dual-recorded pairings in our platform data is typically about 2.4%.
Is the VLamax from a single field test reliable? It is model-derived: computed from the same joint model fit as everything else and calibrated so the population lands on a mean of 0.5, the anchor we also use in lactate-based testing. Where athletes bring lactate step tests, the system uses those directly. An independent lactate-based validation of individual VLamax — like the VO2max validation in this article — is on our list; until it's published, treat the VLamax as a consistent model estimate rather than a lab-equivalent measurement.
How much does a lab VO2max test cost — do I still need one? In Germany, a spiroergometry typically runs 150 to 300 euros per visit (market check, August 2026). For most athletes, the Powertest answers the training questions at no extra cost and higher frequency. A lab visit remains valuable if you need a medically certified absolute value, the full cardiopulmonary picture, or your personal oxygen economy measured — which our system then uses.
How often should I retest? At least once a year — more often is better. As a practical coaching cadence: every four to eight weeks in a structured plan, whenever the result will shape the next training block. You test on the same device you train with, so a stable device bias drops out of the comparison between two tests — the change is the metric your training decisions should run on. (A formal test-retest reliability study of the Powertest itself is on our validation list.)
Does this apply to running too? Not yet with publication-ready numbers. Our running validation shows the power model itself needs individual economy input (we're on it, with Stryd data). Cycling numbers in this article do not transfer to running.
Sources: Mader, A. & Heck, H. (1986). A theory of the metabolic origin of "anaerobic threshold". International Journal of Sports Medicine, 7(Suppl 1), S45–S65. · Mader, A. (2003). Glycolysis and oxidative phosphorylation as a function of cytosolic phosphorylation state and power output of the muscle cell. European Journal of Applied Physiology, 88(4-5). · Internal validation cohorts: two laboratory studies conducted as part of a joint research project with MSH Medical School Hamburg (2022: 33 pairings; 2025: 10 pairings; Cosmed metabolic carts; one test per athlete); a scientific publication of the underlying cohorts is planned as the joint study program continues; analysis code and per-cohort statistics documented internally, powertest engine v1.8.1. · Platform data basis: 15,000+ Powertests, 1,000+ tested athletes, 1M+ analyzed training sessions.