Low Cadence and VO2max: 4 Studies + 658 Test Pairs (2026)
An athlete sent us a reel last week with one line attached: "I could swear I heard the opposite on your podcast." The reel claimed that low-cadence intervals — 50–70 rpm — raise VO2max nearly twice as much as riding at your freely chosen cadence. He was right about the podcast. He was also right to ask. So we pulled the paper, read it in full, put it next to the other trials that asked the same question — and then checked 658 pairs of our own Powertests. Here is what cadence actually changes, and what it doesn't.
What the reel claimed
The numbers came from a real study: 8.7% VO2max improvement at 50–70 rpm versus 4.6% at freely chosen cadence above 80 rpm, in 24 well-trained female cyclists aged 17–20, over eight weeks. Maximal aerobic power was up 8.1% against 3.0%. As the mechanism, the reel offered greater glycogen depletion in type II fibres at low cadence, and as the application: ride your "zone 3/4" intervals — tempo and threshold, in the five-zone model the reel uses — at 50–70 rpm during base season.
The figures are quoted correctly. That is worth saying plainly, because what follows is not a claim that someone made the numbers up. The problem is what the numbers are attached to.
What the study actually did
The paper is Hebisz & Hebisz (2024) in PLOS ONE. Twenty-six riders were recruited, 24 finished — twelve per group, at least three years of racing experience, at least ten training hours per week. Their baseline VO2max was 54.5 ml/min/kg: well trained by the paper's classification, and young enough that how much further they could develop isn't something a starting value tells you.
Both groups rode the same eight-week polarized programme in four-day microcycles — sprint intervals, then high-intensity intervals, then a long endurance ride, then active recovery. Same volume, same structure, outdoors on their own bikes:
- Sprint intervals: 8 to 12 reps of 30 seconds all-out, 90 seconds recovery
- High-intensity intervals: 4 to 6 reps of 4 minutes at 90–100% of maximal aerobic power
- Endurance: 150 to 180 minutes at VT1 — the first ventilatory threshold, where breathing first picks up noticeably
One thing separated the groups: cadence during the two interval sessions. The control group chose freely above 80 rpm. The intervention group held 50–60 rpm in the sprints and 60–70 rpm in the 4-minute efforts.
There was no do-nothing control arm. For the practical question — which of two ways to train works better — that's the right design: hard training against hard training. What it can't do is separate the training effect from repeat-test familiarity and natural development over eight weeks, because nothing in the study stood still.
The result nobody put on a graphic
Here are the main outcomes from the paper. The p-values in the table test the change within each group; the direct between-group test comes after.
| Measure | Free cadence (>80) | p (within) | Low cadence (50–70) | p (within) |
|---|---|---|---|---|
| VO2max ml/min/kg | 54.4 → 56.4 | 0.108 | 54.5 → 59.3 | <0.001 |
| VO2max l/min | 3.02 → 3.16 | 0.032 | 3.09 → 3.36 | <0.001 |
| Max aerobic power W | 259.8 → 267.5 | 0.423 | 268.8 → 290.7 | 0.001 |
| VT1 W | 128.4 → 138.5 | 0.459 | 129.0 → 157.1 | 0.002 |
| VT2 W | 195.7 → 203.0 | 0.132 | 197.7 → 232.3 | 0.001 |
| Gross efficiency % | 18.0 → 18.2 | 0.970 | 18.3 → 18.8 | 0.487 |
| Body mass kg | 55.5 → 56.2 | 0.394 | 56.6 → 56.6 | 0.999 |
The 8.7% and 4.6% headline figures are the changes in absolute VO2max (l/min); recomputing from the rounded relative values gives slightly different percentages.
The paper does report the direct comparison — the group-by-time interaction — for three outcomes: relative VO2max (p = 0.02, η² = 0.23), maximal aerobic power (p = 0.03, η² = 0.18) and maximal ventilation (p = 0.04). Those are statistically significant between-group differences; with twelve riders per arm, the uncertainty around them is wide. For VT1 and VT2 there is no such test — the threshold gains are within-group only, so "low cadence improved thresholds more" is not something the paper's statistics establish.
Now read the free-cadence column again. Eight weeks of polarized training with two interval sessions a week moved the control group's maximal aerobic power by 7.7 watts — not significant. Threshold power by 7 watts — not significant. Relative VO2max — not significant.
That makes the interpretation hard. A comparison group that barely changes despite structured sprint and VO2max work could reflect sample size, spread, the actual load they rode, or something else uncontrolled — and it leaves open whether low cadence worked unusually well or the other condition unusually poorly. Part of it is statistical power: the control group's power output scattered at ±44 W against ±30 W in the low-cadence group, and with twelve riders per arm, that width swallows a real effect. Part of it points somewhere else.
Four things the paper doesn't settle
They rode uphill. To force the low cadence, the intervention group did their intervals on 6–9% gradients. The methods section never states whether the control group did the same — the sentence sits directly after both groups are described, with no attribution. If only one group climbed, the study didn't compare cadence; it compared hill reps against whatever the others did. That isn't a hypothetical difference: Nimmerichter and colleagues measured the same riders uphill and on the flat and found 4–6% more power on the climb (p < 0.001).
The watts were measured and never reported. Every rider had a PowerTap; heart rate came off a Garmin Edge. The paper contains not one power value and not one heart rate value from the training sessions. So there is no way to check whether both groups did the same external work — which is exactly the condition you need before you can credit cadence with the difference.
The contradicting literature is missing. The authors justify their novelty by saying Paton et al. had no high-cadence comparison group. For Paton, Hopkins & Cook (2009) that isn't right — their comparison group rode 110–120 rpm. Kristoffersen (2014) and Nimmerichter (2011), both of which found no advantage for low cadence, don't appear in the reference list at all.
The test didn't fix cadence. The ramp protocol — 40 W, plus 40 W every three minutes — prescribes no cadence. Eight weeks of practice at one pedalling speed can carry into a test that lets you choose it. Nutrition wasn't recorded and menstrual cycle wasn't controlled for. On the credit side: a verification bout at 110% of peak power the next day, which is a properly rigorous way to confirm a VO2max.
What the other trials found
Nimmerichter and colleagues (2011) added what Hebisz lacks — a genuine control group doing no interval training — but kept cadence coupled to terrain: eighteen trained men rode 6×5 minutes at threshold either at 60 rpm uphill or at 100 rpm on the flat, twice a week for four weeks. In the laboratory ramp test, the equivalent of the Hebisz measurement, there were no group differences at all. Everyone improved a little; cadence changed nothing. The low-cadence group did gain 4.4% in the uphill time trial, which reads like a win until you see that the control group, doing no intervals whatsoever, gained 4.0% in the same test.
Kristoffersen (2014) ran it longer: twelve weeks, 22 well-trained veterans, 5×6 minutes at 40 rpm against self-selected. No VO2max gain, no peak power gain from the low-cadence work. The self-selected group came out ahead on several measures.
Paton, Hopkins & Cook (2009) is the second study to favour low cadence, and it's a cleaner cadence comparison than it's often given credit for: both groups did the same explosive single-leg jumps and the same ergometer sprints, and differed only in pedalling speed — 60–70 versus 110–120 rpm. Low cadence won. Note what it beat: not a freely chosen 85–90, but 110–120, a cadence as far above the optimum for hard efforts as 50 is below it. The jumps are a limitation — their interaction with cadence is unknown — not a disqualification.
| Study | Riders | Design | Outcome |
|---|---|---|---|
| Hebisz 2024 | 24 women, VO2max 54.5 | 8 wks, sprints + HIIT at 50–70 vs >80 rpm | Larger gains at low cadence; between-group test significant for VO2max and peak power, not run for thresholds |
| Paton 2009 | 18 road cyclists | 4 wks, jumps + sprints at 60–70 vs 110–120 rpm | Low cadence better — against a very high comparison cadence |
| Nimmerichter 2011 | 18 men, VO2max 58.6 | 4 wks, 6×5 min: 60 rpm uphill vs 100 rpm flat vs true control | No group difference in the lab test. Uphill TT gain matched by the no-intervals control |
| Kristoffersen 2014 | 22 veterans, VO2max 57.9 | 12 wks, 5×6 min at 40 rpm vs self-selected | No VO2max or peak power gain from low cadence |
Two trials for, two against — and the protocols, populations, cadences and comparison groups are too different for a simple vote. Both trials that favour low cadence compared it against something other than a normal racing cadence: an unspecified free choice above 80, or 110–120. What the four add up to is an open question, and an open question is not something to rebuild your training week around.
Cadence isn't a number. It's a contraction speed.
Here is the part that gets lost when the debate is framed as "high or low," and it is the most practically useful finding in this debate.
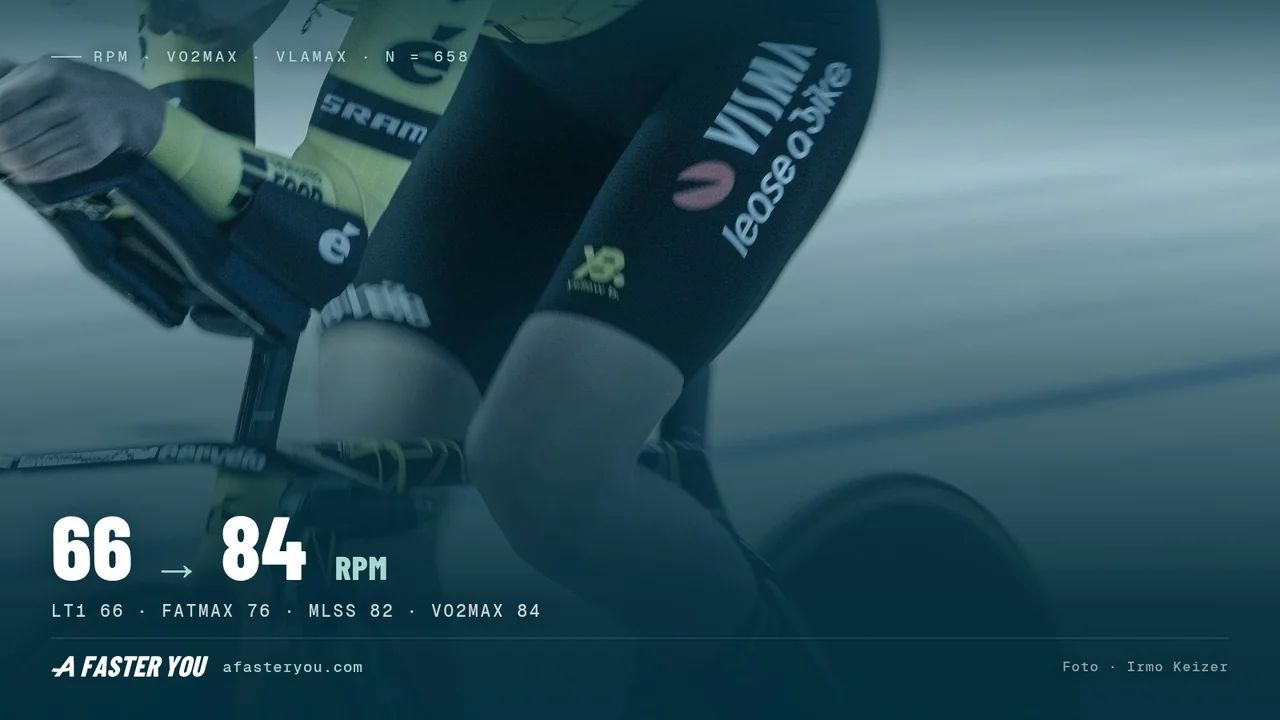
Dunst, Hesse & Ueberschär (2024) tested fourteen professional track cyclists at 60, 90 and 120 rpm across increasing work rates, then derived force-velocity and power-velocity profiles for each metabolic state. From those profiles they modelled the cadence at which power output peaks for that state. In this group of fourteen, that power-optimal cadence was not one number — it climbed with intensity:
| Metabolic state | Modelled optimal cadence rpm |
|---|---|
| LT1 — first lactate threshold, the top of easy riding | 66 ± 3 |
| FATmax — highest fat oxidation | 76 ± 3 |
| MLSS — highest power with stable blood lactate | 82 ± 3 |
| VO2max | 84 ± 3 |
| Fatigue-free maximum (sprint) | 135 ± 11 |
The authors' explanation is Henneman's size principle with a speed dimension added: slow oxidative fibres have a low optimal contraction velocity, faster fibres have higher ones, and as intensity rises you recruit progressively faster fibres, so the cadence that suits the working muscle rises with them. It's a plausible mechanism rather than a demonstrated one — the study measured the relationship, not the fibres — but it fits what everyone in this argument has been observing.
Because it reconciles the argument that has run through cycling for forty years. The classic finding is Coast & Welch (1985): in trained racers, the cadence that cost the least oxygen for a given power was low at low power and rose linearly as power increased. Low-cadence advocates and high-cadence advocates have been measuring different intensities. Cadence is a proxy for how fast your muscle is being asked to contract, and the right answer moves with the effort.
And it puts the reel's advice upside down. Its recommendation — 50–70 rpm for tempo and threshold intervals — sits furthest from the modelled optimum precisely where intensity is highest: at threshold and above, fourteen professionals landed at 82–85 rpm. A small, specialised sample is not a universal prescription, and deliberate torque work has its place. But it is a poor basis for making 50–70 the default for hard intervals.
The axis the study never measured
Our plans are built on two numbers, not one. Alongside VO2max sits VLamax — the modelled maximal glycolytic rate, how fast your muscles can produce lactate and the energy that comes with it. It is not the same as how much carbohydrate you burn overall; it's the ceiling of the fast pathway. In our own test pairs, described below, changes in the two estimates are positively associated: +0.01 VLamax for every ml/min/kg of VO2max gained, after adjusting for where each athlete started. Both estimates come from the same test model, so this describes how they move in our data, not a shared mechanism.
That matters here because the Hebisz paper measured neither blood lactate nor lactate formation rate — only respiratory gases and ventilatory thresholds. Threshold power can rise for several reasons: a bigger engine, a lower glycolytic rate, better economy, a larger usable fraction of VO2max. Without lactate data the study cannot say which of these produced the low-cadence group's 35 W at VT2. In our model, the second route — a lower VLamax at unchanged VO2max — raises threshold power on its own, and it is not a VO2max adaptation. The study can't rule it in or out.
Which way does cadence push VLamax? Our coaching experience — and the podcast, going back to 2022 — says pedalling speed drives the glycolytic rate: high cadence in hard intervals raises it, a big gear keeps it in check. That's why, when a rider's lactate formation is already high, we send them to sweet spot and threshold work in a heavy gear, and when it's too low, we tell them to spin. Our data point the same way, cautiously. Here they are.
What 658 of our own test pairs say
We've run more than 15,000 standardized Powertests. For this analysis we applied the strictest standard: only tests that completed the full protocol without any flag — no internal test accounts, no aborted recordings. That's just under 11,000. From those we took cycling tests with a one-second cadence recording and paired each athlete's consecutive tests 28 to 180 days apart: 658 pairs from 438 athletes, as of September 2026.
No link between cadence and VO2max change. Test cadence, overall training cadence, cadence in hard sessions, or a change in cadence between tests — none of them showed a statistically clear association with how VO2max changed. More useful than the p-values is what the data rule out: for cadence in VO2max and sprint sessions, the 95% interval runs from −0.5 to +0.7 ml/min/kg per 10 rpm. The Hebisz difference works out to roughly 1.2 per 10 rpm. An effect of the size the reel promises is outside what our athletes show. What was associated with VO2max change, in the 243 pairs with training data in between, was training volume: +0.14 ml/min/kg per weekly training hour (p = 0.014).
Cadence in hard sessions was associated with VLamax change. Athletes who rode their VO2max and sprint sessions at a higher cadence saw their VLamax estimate rise more — +0.02 per 10 rpm (95% interval +0.003 to +0.04, p = 0.02, 242 pairs). Overall training cadence showed no such association, and the hard-session coefficient held when both were in the model together. This is an observational association from a modest sample, not a demonstration that cadence caused the change. Its direction is the one our coaching has assumed for years, and the opposite of what the reel implies.
Riders already pedal the laboratory curve. In the same 242 training windows, freely chosen cadence rose with intensity: 73 rpm in the easy zones, 82 in tempo-to-threshold, 88 in VO2max and sprint work. One caveat: our zone averages include coasting seconds, which are more common in easy riding and may exaggerate the gradient. The direction matches the curve Dunst and colleagues derived on the ergometer.
Methodology: how we built this
Cadence for each test was read from the one-second recording inside the 12-minute segment — the window of highest 12-minute mean power, which matched the stored segment power with a median difference of 0.4 W. (The 5-second and 4-minute windows were extracted too but are not used in the results above.) For each pair we modelled the change in VO2max or VLamax against cadence, with the athlete's starting VO2max and VLamax as covariates — because a high starting value tends to fall and a low one to rise regardless of anything you do; in our VLamax data almost half of a test's deviation from the mean is gone by the next one. Standard errors are clustered by athlete. We excluded pairs with implausible jumps (|ΔVLamax| ≥ 0.4, 39 pairs; |ΔVO2max| ≥ 15 ml/min/kg, 5 pairs); rerunning without those exclusions on all 701 pairs changes no conclusion. Training between the tests — hours, share of time above threshold, cadence by zone — was available for 243 pairs; one of those lacks hard-zone cadence, hence 242 in the cadence models. These are self-selected A Faster You athletes with repeated tests and recorded training, not a randomized or population-representative sample; the analysis can detect associations, not prove causes.
The carbohydrate part the reel left out
The athlete who sent us the reel added a line of his own: a positive VO2max response also needs adequate carbohydrate. He's pointing at the piece these graphics almost always drop.
The sessions that raise VO2max are the expensive ones. Carbohydrate availability is what lets you ride them at the intended intensity and repeat them through a block — the "fuel for the work required" principle (Impey et al. 2018): match carbohydrate to the demands of the session, the training load and your overall energy availability. Low availability can be periodized deliberately into other sessions; it is a poor fit for the ones meant to raise your ceiling. That makes fuelling a design decision rather than a prerequisite for every adaptation — and for VO2max work, an easy decision.
Which is also why cadence is not the first lever we reach for. Fuelling, session structure and time at your oxygen ceiling all move VO2max more reliably than pedalling speed — see VO2max intervals for what the dose actually looks like.
What we prescribe, and where low cadence does belong
Every workout template in an A Faster You plan defaults to 85–95 rpm. That's the plan's practical standard, not a number lifted from a study: the modelled optimum for threshold and VO2max work, 82–85, sits at its lower edge, and our own athletes settle at 88 in their hard sessions without being told.
Low-cadence work exists in the plan too — deliberately placed. You'll find 50–60 and 55–65 rpm blocks in sweet spot, threshold and FATmax sessions, where the goal is force production and torque tolerance, and where — if our signal holds — the big gear keeps the glycolytic stimulus in check. You will not find them inside the VO2max intervals. The reasons are separate and don't all carry the same weight: the modelled optimum there is 84 rpm; our data show no VO2max advantage for low cadence and rule out one of the size the reel claims; and specificity — you race hard efforts at 85–95, so you train them there.
There is a third reason to ride a big gear now and then, and it has nothing to do with VO2max: your event demands it. A steep marathon climb, a 25% ramp on a gravel course, a technical off-road section — if you'll be turning 50 rpm on race day, you'd better have trained it. That's specificity, and it's a good reason. "It raises your VO2max" isn't.
Measure the engine before you change the gear
Whether low cadence helps or hurts you depends on which side of your engine needs work — and that is knowable rather than guessable. The Powertest measures your VO2max and VLamax from a standardized effort on your own bike — how close that gets to the laboratory is in Powertest accuracy, 43 athletes against gas exchange — and the plan sets cadence targets from your profile rather than from a graphic.
Run a Powertest and start your free trial →
One last thought on the 8.7% figure. Rønnestad et al. (2015) reported the same VO2max increase for short intervals against +2.6% for effort-matched long ones. The matching number doesn't make the studies equivalent — populations, protocols and controls all differ. Before you rebuild a training block around any percentage, ask what was compared, whether the load was documented, and whether the difference was tested directly between groups.
FAQ
Does low-cadence training raise VO2max? Two trials say yes — Hebisz & Hebisz (2024), 8.7% versus 4.6% with a significant between-group difference, and Paton (2009) against a 110–120 rpm comparison. Two say no: Nimmerichter (2011) found no group difference in a lab ramp test, and Kristoffersen (2014) no VO2max or peak power gain over twelve weeks. In 658 of our own test pairs, cadence showed no association with VO2max change, and the data rule out an effect as large as the one the reel claims. The evidence does not currently support low cadence as a VO2max method.
What is the optimal cycling cadence? It depends on intensity, and it rises with it. In fourteen professional track cyclists, the modelled power-optimal cadence was 66 rpm at the first lactate threshold, 76 at FATmax, 82 at maximal lactate steady state and 84 at VO2max (Dunst, Hesse & Ueberschär 2024). Our own athletes show the same shape in training — 73, 82 and 88 rpm across easy, threshold and VO2max zones — with the caveat that coasting seconds pull the easy-zone figure down.
Why do older studies say 50–60 rpm is optimal? Because they measured low power outputs, where a low cadence really is the most economical. Coast & Welch (1985) showed the optimum rising linearly with power in trained racers. Optimal cadence appears to track the contraction velocity of the fibres you're recruiting, so it climbs as the effort gets harder. Both findings are correct for the intensity they were measured at.
Is riding a big gear useless then? No — it's just a different tool. Low-cadence, high-torque work trains force production, and it's specific preparation for events with steep climbs or off-road terrain where you'll have no choice. In our data it's also associated with a quieter glycolytic side of the engine. What it isn't is a reliable way to raise VO2max.
Should I do my VO2max intervals at low cadence? We don't recommend it. The modelled optimum at VO2max intensity is around 84 rpm, and in our data cadence showed no link to VO2max gains. If your goal is a lower VLamax, the tool for that is big-gear work at sweet spot and threshold, not grinding your VO2max intervals.
Does cadence affect the VO2max my watch shows? It can. Watches that estimate VO2max from the relationship between heart rate and power read a lower heart rate at the same watts as a better oxygen uptake — and cadence shifts that relationship. On our podcast (episode 43, in German), Niclas described riding two weeks at 70 instead of 90 rpm and watching his watch go from 62 to 74. No laboratory measurement was taken, so nobody can prove nothing changed — but a jump that size in two weeks is far too large to be training, and exactly what a cadence-driven estimate artefact would look like. How close these estimates get in general is in Garmin VO2max accuracy.
What about carbohydrate? Fuelling is not a side note to this. Sessions meant to raise VO2max need carbohydrate available to be ridden at the required intensity and repeated through a block. Underfuelled interval work tends to be lower-quality work, whatever cadence you ride it at.
Low-cadence intervals: Hebisz, R. & Hebisz, P. (2024) — Greater improvement in aerobic capacity after a polarized training program including cycling interval training at low cadence (50–70 RPM) than freely chosen cadence (above 80 RPM). PLOS ONE, 19(11):e0311833. Other trials: Paton, C.D., Hopkins, W.G. & Cook, C. (2009) — Effects of low- vs. high-cadence interval training on cycling performance. J Strength Cond Res, 23(6):1758–1763; Nimmerichter, A., Eston, R., Bachl, N. & Williams, C. (2011) — Effects of low and high cadence interval training on power output in flat and uphill cycling time-trials. Eur J Appl Physiol, 112(1):69–78; Kristoffersen, M. et al. (2014) — Low cadence interval training at moderate intensity does not improve cycling performance in highly trained veteran cyclists. Front Physiol, 5:34. Optimal cadence by metabolic state: Dunst, A.K., Hesse, C. & Ueberschär, O. (2024) — Understanding optimal cadence dynamics: a systematic analysis of the power-velocity relationship in track cyclists with increasing exercise intensity. Front Physiol, 15:1343601. Optimal cadence rising with power: Coast, J.R. & Welch, H.G. (1985) — Linear increase in optimal pedal rate with increased power output in cycle ergometry. Eur J Appl Physiol Occup Physiol, 53(4):339–342. Fibre-type glycogen depletion at 50 vs 100 rpm: Ahlquist, L.E., Bassett, D.R., Sufit, R., Nagle, F.J. & Thomas, D.P. (1992) — The effect of pedaling frequency on glycogen depletion rates in type I and type II quadriceps muscle fibers during submaximal cycling exercise. Eur J Appl Physiol, 65(4):360–364. Carbohydrate periodization: Impey, S.G. et al. (2018) — Fuel for the work required: a theoretical framework for carbohydrate periodization and the glycogen threshold hypothesis. Sports Med, 48(5):1031–1048. Short vs long intervals: Rønnestad, B.R. et al. (2015) — Scand J Med Sci Sports, 25(2):143–151. Metabolic model: Mader, A. & Heck, H. (1986) — Int J Sports Med, 7(Suppl 1):45–65. Own data: 658 pairs of consecutive Powertests from 438 cyclists, drawn from just under 11,000 fully valid tests out of 15,000+ standardized Powertests, September 2026.