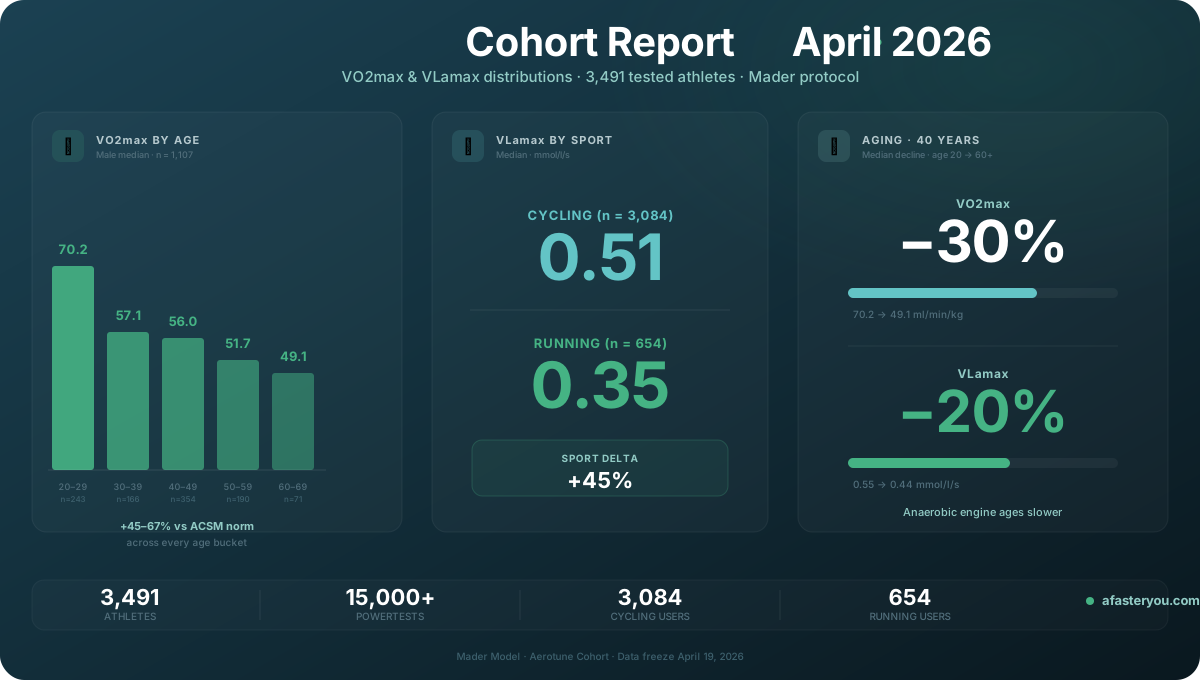
Cohort Report: VO2max & VLamax in 3,491 Tested Endurance Athletes
This is a data report. No training advice, no product pitch — just what the numbers look like when you measure 3,384 endurance athletes with the same Mader-model protocol and compare them against ACSM's general-population norms.
The headline finding: trained endurance athletes sit 43–60 % above the median VO2max of the general population across every age bucket we tested. A 60-year-old on our platform has the aerobic capacity of a typical 25-year-old. That's not a marketing number — it's what structured training over years produces, measured across a cohort that agreed to have their Powertests counted.
We publish this report because the question "is my VO2max any good?" has no honest answer without a comparison group. ACSM norms give you one reference. This cohort gives you another — the one that matters if you're training seriously.
At a glance
- 3,384 athletes with at least one Powertest at test quality
- Males publication-ready across all age groups (n ≥ 55 per bucket)
- Females preliminary (n < 40 per bucket from age 40 — ongoing data recovery)
- Cycling cohort 3,121 athletes · Cycling median VLamax 0.49 mmol/l/s
- Running cohort 618 athletes · Running median VLamax 0.36 mmol/l/s
- Against ACSM norms for the general population: +43 % to +60 % across every age
VO2max by age and gender
Values are the median (P50) for each age bucket, in ml/min/kg.
Male cohort (n = 1,595)
| Age group | n | P10 | P25 | P50 | P75 | P90 |
|---|---|---|---|---|---|---|
| Under 20 | 115 | 56.1 | 63.4 | 67.9 | 72.2 | 76.6 |
| 20–29 | 290 | 51.9 | 58.3 | 67.1 | 74.5 | 78.9 |
| 30–39 | 548 | 45.7 | 52.3 | 58.7 | 66.2 | 74.8 |
| 40–49 | 385 | 42.1 | 48.3 | 54.3 | 60.2 | 65.2 |
| 50–59 | 182 | 41.7 | 45.3 | 50.8 | 55.0 | 59.1 |
| 60–69 | 55 | 37.0 | 42.9 | 48.9 | 54.4 | 60.8 |
| 70+ | 20 | 38.7 | 45.9 | 49.0 | 54.6 | 59.4 |
The age buckets only include athletes who have entered a birth year — roughly half the cohort leaves that field blank. The totals further up therefore rest on more athletes than this table sums to.
Female cohort (n = 200, preliminary)
| Age group | n | P10 | P25 | P50 | P75 | P90 |
|---|---|---|---|---|---|---|
| Under 20 | 9 | 47.3 | 51.3 | 54.8 | 56.4 | 62.8 |
| 20–29 | 55 | 44.7 | 50.4 | 56.9 | 60.0 | 66.0 |
| 30–39 | 78 | 40.0 | 46.0 | 51.1 | 58.8 | 66.6 |
| 40–49 | 36 | 41.1 | 45.5 | 49.9 | 54.3 | 57.5 |
| 50–59 | 12 | 36.0 | 37.8 | 45.1 | 50.5 | 58.5 |
| 60–69 | 6 | 37.2 | 38.4 | 43.4 | 51.5 | 53.9 |
| 70+ | 4 | 37.0 | 41.0 | 45.3 | 47.7 | 48.0 |
Note on the female cohort: The under-20 and 50+ buckets currently hold n < 15. Values here are shown for transparency but are not yet publication-stable. We will update them once the ongoing profile-completion effort closes.
Against ACSM general-population norms
The most reliable public reference for VO2max is ACSM's Guidelines for Exercise Testing and Prescription (11th Edition) — population-level norms derived from a broad adult sample. Here's how our male median compares:
| Age group | A Faster You P50 ♂ | ACSM P50 (general) ♂ | Delta |
|---|---|---|---|
| 20–29 | 67.1 | ~42 | +60 % |
| 30–39 | 58.7 | ~41 | +43 % |
| 40–49 | 54.3 | ~38 | +43 % |
| 50–59 | 50.8 | ~35 | +45 % |
| 60–69 | 48.9 | ~31 | +58 % |
The pattern across every age bucket: an A Faster You-tested male is 43–60 % above the general-population median. A typical 60-year-old on our platform hits VO2max values that the general population reaches only in the early 20s — and only in the top tail of that age group.
This isn't because testing on the platform makes you fit. It's the population that shows up for a Powertest: people who already train structured, who look at their numbers, who come back for the retest six weeks later.
VLamax by sport and age
VLamax — the maximum glycolytic lactate production rate — differs radically between disciplines. Cycling produces systematic short power-peaks (attacks, climbs, position changes). Running is more uniformly aerobic. The cohort data confirms it:
Cycling (n = 3,121 athletes)
| Age group | n | P10 | P25 | P50 | P75 | P90 |
|---|---|---|---|---|---|---|
| Under 20 | 124 | 0.33 | 0.47 | 0.57 | 0.66 | 0.81 |
| 20–29 | 343 | 0.34 | 0.43 | 0.54 | 0.68 | 0.78 |
| 30–39 | 605 | 0.28 | 0.39 | 0.49 | 0.62 | 0.74 |
| 40–49 | 404 | 0.28 | 0.37 | 0.46 | 0.59 | 0.72 |
| 50–59 | 188 | 0.26 | 0.34 | 0.42 | 0.52 | 0.67 |
| 60–69 | 58 | 0.23 | 0.34 | 0.45 | 0.53 | 0.71 |
| 70+ | 24 | 0.25 | 0.33 | 0.41 | 0.56 | 0.71 |
| Overall | 3,121 | 0.28 | 0.38 | 0.49 | 0.62 | 0.75 |
| ### Running (n = 618 athletes) |
| Age group | n | P10 | P25 | P50 | P75 | P90 |
|---|---|---|---|---|---|---|
| 20–29 | 24 | 0.23 | 0.29 | 0.39 | 0.46 | 0.58 |
| 30–39 | 83 | 0.25 | 0.33 | 0.39 | 0.45 | 0.54 |
| 40–49 | 70 | 0.20 | 0.25 | 0.34 | 0.41 | 0.49 |
| 50–59 | 25 | 0.17 | 0.21 | 0.29 | 0.38 | 0.41 |
| Overall | 618 | 0.21 | 0.27 | 0.36 | 0.44 | 0.54 |
Cycling median VLamax 0.49 vs. running median 0.36 — a +36 % gap. Same methodology, same platform. The discipline alone moves the number.
VLamax distributions — all Powertests
Aggregated across every valid Powertest (not just latest-per-athlete), the histogram shows two clean peaks:
Cycling (n = 7,445 Powertests)
| VLamax bin | # tests |
|---|---|
| 0.10–0.19 | 137 |
| 0.20–0.29 | 641 |
| 0.30–0.39 | 1,198 |
| 0.40–0.49 | 1,744 (mode) |
| 0.50–0.59 | 1,663 |
| 0.60–0.69 | 994 |
| 0.70–0.79 | 602 |
| 0.80–0.89 | 316 |
| 0.90–0.99 | 148 |
| 1.00+ | 2 |
| ### Running (n = 1,102 Powertests) |
| VLamax bin | # tests |
|---|---|
| 0.10–0.19 | 85 |
| 0.20–0.29 | 254 |
| 0.30–0.39 | 361 (mode) |
| 0.40–0.49 | 227 |
| 0.50–0.59 | 104 |
| 0.60–0.69 | 34 |
| 0.70–0.79 | 24 |
| 0.80–0.89 | 8 |
| 0.90–0.99 | 5 |
Both distributions effectively end at 1.0. Earlier versions of this report showed a long cycling tail beyond that point — it came from a quirk in how ramp tests were evaluated, corrected in August 2026, not from the athletes. What separates the disciplines today is the centre of mass, not the extreme: the cycling mode sits at 0.40–0.49, the running mode a full bin lower at 0.30–0.39, and above 0.60 running holds only about a twentieth of its tests.
Four findings from the data
1. Sport matters more than age for VLamax. The cycling median sits roughly a third above the running median in every age bucket — across the full cohort 0.49 against 0.36, a +36 % gap. The physiological profile is shaped by the demands of the sport: years of short power-peaks in cycling, years of steady-state aerobic running. You don't get to pick one without committing to the training that creates it.
2. VLamax ages more slowly than VO2max. Cycling VLamax drops from P50 0.54 (20–29) to P50 0.42 (50–59) — roughly a 22 % decline across three decades. VO2max falls from 67.1 to 50.8 in the same window, 24 %, and keeps going after that. The anaerobic engine holds longer than the aerobic one. For masters athletes choosing where to defend, this is useful context: VO2max loss is steeper and less preventable, sprint capacity is more defendable.
3. What separates the disciplines is the centre of mass, not the extreme. Cycling and running both effectively end at VLamax 1.0 — the long cycling tail beyond it, shown in earlier versions of this report, was a quirk of ramp-test evaluation rather than an athlete trait. What remains is a clear shift of the whole distribution: the cycling mode sits at 0.40–0.49, the running mode a full bin lower, and above 0.60 running holds only about a twentieth of its tests. A track sprinter or criterium specialist sits in the top fifth of the cycling range — not in a world of their own beyond the scale.
4. A Faster You masters hold elite-adjacent numbers. The top 10 % of our 60–69 male cohort (P90 = 60.8 ml/min/kg) hits VO2max values the general population only reaches as young adults — and then only at the top of that range. Structured training plus continuous data feedback delays the aerobic decline substantially.
Limitations and caveats
- Self-selection bias: These are athletes who chose to buy a Powertest. They train harder and test more consistently than the general population — and than the general endurance population. This is not a random sample.
- Female buckets ≥ 50: n < 10 in the oldest female groups. Medians there are indicative, not stable.
- Cohort ranges are medians, not guidance: Your personal optimum depends on your discipline, goals, and body composition. Use these numbers as a reference scale, not a target.
- Single snapshot: This report is the state as of April 2026. We retest the cohort quarterly — figures will evolve.
Sources and methodology
For this report we applied the strictest standard our database allows:
| Step | Scope | Why |
|---|---|---|
| Powertests on the platform | 15,000+ | the data base |
| of those, at test quality | almost 9,000 | only tests that completed the protocol fully and without anomalies — internal test accounts and aborted recordings excluded — and whose values sit in the plausible range (VO2max 18–100, VLamax 0.05–1.3) |
| then one record per athlete per sport | 3,384 athletes | the most recent test each, so multi-tested athletes don't weight the median upward |
- Age buckets only include athletes who have entered a birth year — roughly half the cohort leaves that field blank. The age groups therefore sum to less than the overall total.
- Exclusions: internal test accounts plus a non-organic senior study dataset
- Reference: American College of Sports Medicine — Guidelines for Exercise Testing and Prescription, 11th Edition (2021)
- Model: Metabolic testing based on Prof. Alois Mader's two-limiter model (Mader 2003, European Journal of Applied Physiology 88:317–338; Mader & Heck 1986, International Journal of Sports Medicine 7 Suppl 1:45–65). Since August 2026 every test protocol uses the same accounting for the creatine-phosphate store; earlier versions of this report therefore showed higher cycling VLamax values, particularly in the upper tail.
- Validation of the measure itself: how close the Powertest VO2max values analysed here sit to lab spirometry is documented in Powertest vs lab — 43 lab-validated athletes, mean bias −1.8 ml/min/kg.
- As of: August 2026
For interpretation of VO2max in race context: see Half Marathon VO2max, Marathon VO2max, VLamax vs VO2max. For how these two metrics translate to race times: VO2max chart by age and gender. For the efficiency layer on top: Running Economy.