Watts Per Heartbeat and Cardiac Drift, Measured (2026)
Two riders finish the same three-hour ride at the same average power. One averaged 138 bpm, the other 171. Same work, two very different engines — and your ride file already knows.
The two numbers we pull out of every ride
Most of what you can learn about aerobic fitness from heart rate hides behind a standardised test: a ramp protocol, a lab, a fixed warm-up, a controlled room. We wanted two of those answers from ordinary training rides instead — the ones you already do, with intervals, traffic lights, headwind and all.
There are exactly two:
- Efficiency — how much power you put on the road per heartbeat, in W/bpm.
- Drift — how far your heart rate climbs over the hours, in bpm/h, once the power you produced has been accounted for.
The order matters. Efficiency is the number to watch. Drift is the interesting one, but it is noisier, and we will be very specific about that below.
The model underneath: heart rate as a system, not an average
Both numbers come from the same place — a physiological heart rate model published by de Smet, Francaux, Hendrickx and Verleysen in 2016. Its core is disarmingly simple. At steady state, your heart rate is your resting heart rate plus a term proportional to power:
HR_target = HR_rest + m · P
m is the slope in bpm/W: how many beats per minute each additional watt costs you. Its inverse, 1/m, is your efficiency in watts per heartbeat. On top of that sit two time constants — heart rate rises faster than it falls, 24 s versus 30 s in the original paper — a ceiling at your maximum heart rate, and a drift term that grows with accumulated work.
We fit all six parameters for each individual session. No test protocol, no ramp, no lab. The original authors reported that heart rate simulated this way matches the measured signal to an average error of 4 bpm on the bike and 6 bpm on the run. On our own quality-checked cycling sessions the median simulation error is 4.7 bpm — close enough to the published figure that we trust the implementation, and honest enough that we will not claim better.
That fit runs across the whole platform, not on a hand-picked sample: 1,166,119 of 1,743,367 activities carry fitted heart rate parameters — 67 % — and 772,537 of those pass our quality checks. The gap is not mysterious. Rides without a heart rate strap, rides without power, files too short or too broken to fit anything sensible.
Efficiency: 4.0 watts per heartbeat is the middle of the field
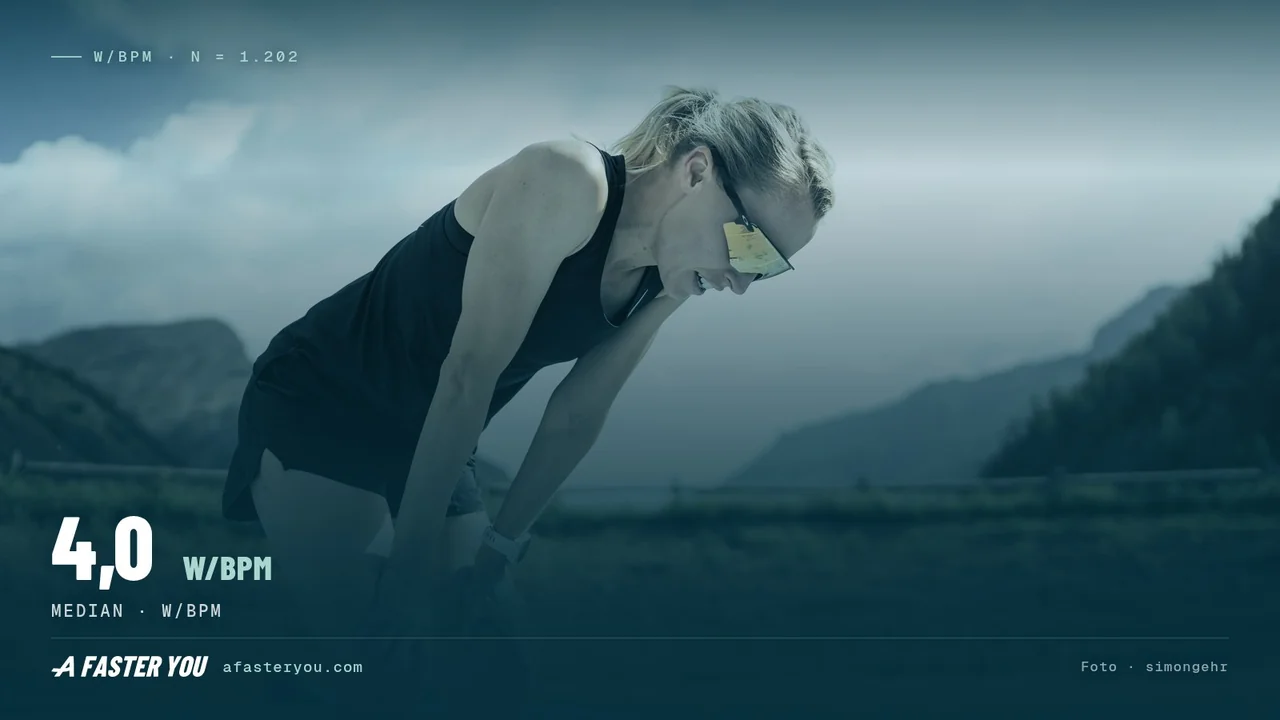
Across our cycling data, the median athlete produces 4.0 W/bpm. Read that as a rate of exchange: every extra 4 watts costs this athlete one extra beat per minute. An athlete at 5.4 W/bpm buys the same 4 watts for three quarters of a beat.
Note what the number is measured against — the rise in heart rate above rest, not the absolute reading. That is why a high resting heart rate does not, by itself, make you look inefficient here, and why the value survives a bad night's sleep better than raw heart rate does.
Runners will recognise the question. Watts per heartbeat asks on the bike what running economy asks on foot: how much output do you get for what it costs you? The currency differs — oxygen there, heartbeats here — the logic does not.
| Efficiency (1/m) | Where that sits |
|---|---|
| below 2.6 W/bpm | bottom 5 % of our cyclists |
| 4.0 W/bpm | median |
| above 5.4 W/bpm | top 5 % |
Those bands come from 200 athletes, each represented by the median of their own sessions. Look at single rides instead and the spread widens considerably — the middle stays at 4.0 W/bpm across 149,389 quality-checked cycling sessions, but the 5th to 95th percentile band runs from roughly 2.4 to 6.7 W/bpm. That difference between "one ride" and "one athlete" is the whole story of reliability, and we come back to it in a moment.
Efficiency behaves the way physiology says it should. Across 200 athletes, the slope m correlates negatively with VO2max (rho = −0.261, p = 0.0002) — which means efficiency, its inverse, rises with VO2max. Fitter athletes move more watts per beat. It is not a tautology: VO2max here comes from a completely separate measurement chain, our power test, not from the heart rate model.
The bigger point is stability. Repeat-measurement reliability for efficiency, expressed as an intraclass correlation, is 0.367 [0.294–0.437] for a single session — and 0.85 when you average ten sessions. That is the number that makes efficiency usable as a training signal. One ride tells you something. Ten rides tell you a lot.
Methodology: how we built these numbers
Distributions come from 355,551 live activities. The head-to-head against Pa:HR uses 2,360 activities from 200 athletes, stratified so that every athlete contributes both easy and hard sessions (1,182 easy / 1,178 hard) — otherwise you end up comparing athletes who happen to ride easy against athletes who happen to do intervals. 400 activities were re-fitted from raw data for the model comparison, and 733 recovery segments went into the kinetics.
Every reliability figure is an intraclass correlation with a bootstrap confidence interval computed over athletes, 600 draws, not over rows. Resampling rows inflates reliability, because two rides from the same athlete are not independent observations.
We also checked the sample is not a fitness bubble: its median VO2max is 58.8 against 59.0 for the full population, VLamax 0.44 against 0.43. Metabolically, it looks like everyone else.
Drift: the second number, and why it needs a longer view
Cardiac drift is the slow upward creep of heart rate during long efforts at constant work. Heat, dehydration, fatigue, falling stroke volume — several mechanisms, one visible symptom.
We do not measure it by comparing halves of a ride. We estimate it inside the model, which has already subtracted what the power output explains. What remains is the part power does not account for.
| Drift (cycling, sessions ≥ 1 h) | Value |
|---|---|
| Median | 2.25 bpm/h |
| 90th percentile | 7.7 bpm/h |
| Independent raw cross-check | 3.1 bpm/h |
Median and 90th percentile come from the 400 cycling sessions we re-fitted for this article (n = 400); the raw cross-check is explained in the next paragraph. None of these is yet what your own history shows: activities stored before 14 August 2026 still carry a capped drift value, which is why the platform-wide stored median currently reads 1.4 bpm/h across 116,778 qualifying sessions. The section The correction we shipped this week, further down, explains what changed and when your history catches up.
The cross-check matters: heart rate per watt in the first third of a ride against the last third, computed straight from the raw file with no model involved at all. Two different methods, the same order of magnitude.
And drift tracks fitness in the expected direction — fitter athletes drift less (rho = −0.321, p < 0.0001, n = 200).
Now the honest part. Reliability of drift from a single session is 0.212 [0.147–0.277]. In plain language: a single ride's drift value is mostly noise. Do not read Tuesday's number as a verdict on your endurance. Averaged over ten sessions the reliability climbs to 0.59, which is where it becomes a signal you can act on. Drift is a weekly trend line, not a daily score, and any product that presents it as a daily score — ours included, if we ever did — would be overselling it.
How this compares with Pa:HR — and what we actually measured
The industry standard here is aerobic decoupling, developed by coach Joe Friel and widely computed as Pw:Hr for power-based rides and Pa:HR for pace-based runs. The recipe: split the session in half, compare the power-to-heart-rate ratio of each half, report the percentage change. Our comparison uses cycling files, so it is the Pw:Hr variant throughout — we keep saying Pa:HR because that is what most athletes call the family of metrics.
It is elegant, it needs no model, and it comes with one limitation its own authors state plainly: it belongs on a long, steady effort — two hours at a constant endurance heart rate is the canonical example. On an interval workout the two halves contain entirely different efforts, so the ratio compares apples to oranges. That is not a flaw. It is a stated scope.
If you already work with that metric, you know the thresholds that go with it: below 5 % decoupling, Friel reads your aerobic endurance as strong at that intensity; 5 to 10 % as a moderate limitation or fatigue; above 10 % as an effort that was probably above your aerobic threshold, or an endurance base not yet able to hold it. Our drift is a different unit — beats per hour, not a percentage — so the two do not convert into each other, and you should not try. They ask the same question in different words: how far did your heart rate run away from the work you were actually doing?
That scope is the reason we needed something else. Most of our athletes' sessions have structure in them.
What we compared, precisely: we applied the Pa:HR method to our own data. We did not measure any app's implementation of it. Any difference below is a property of the method as we implemented it on our files, not a statement about any product that offers it.
That distinction is not legal boilerplate. Attributing numbers to somebody else's system that you never actually observed is how data journalism goes wrong, and we have made that mistake before.
Head to head on the same 2,360 activities from the same 200 athletes — our drift against the decoupling method:
| Our drift | Pw:Hr | |
|---|---|---|
| Athlete signal (ICC) | 0.212 | 0.083 |
| 95 % CI | 0.147–0.277 | 0.054–0.114 |
| Spread within athlete | 99 % | 175 % |
The confidence intervals do not overlap: roughly 2.5 times as much genuine between-athlete signal, at about half the scatter. On the same files, on the same days.
Where we have no advantage: intensity dependence. Both metrics shift with how hard the session was — 22 % for ours, 25 % for Pa:HR. That is a draw, and the honest conclusion is that neither number is intensity-free. Our gain is in signal-to-noise and in being defined at all when the session has intervals in it.
None of this makes Pa:HR wrong. It does what it was built to do, on the sessions it was built for, without needing a six-parameter fit. We built something different because our athletes' training does not look like the sessions Pa:HR assumes.
The correction we shipped this week
Until mid-August, a simplification in our fitting code capped the permitted drift at roughly 1.8 bpm/h. Physiologically that is far too tight — 3 to 10 bpm/h is entirely normal on a long, warm ride. The consequence: the model kept reporting a modest drift for everyone, because it was not allowed to report anything else.
We removed the cap on 14 August 2026. Across the 400 sessions we re-fitted for this comparison, the model now reports a median drift of 2.25 bpm/h against the independent raw cross-check of 3.1 — where before the fix it said 1.2. Same rides, better model.
One caveat we would rather state than have you discover: the correction applies to sessions processed since that date. Older activities in your history still carry the old, capped value until they are re-computed. If your drift chart shows a step change in mid-August, that is us, not you.
We write this up rather than quietly patching it because a model you cannot audit is a model you should not trust. The same reasoning applies to how our VO2max estimator works.
What to do with these two numbers
Read efficiency as your aerobic base. Take the rolling average across your last ten sessions, not today's value. If that average climbs over a training block, your aerobic system is producing more power per beat — the single clearest sign that base work is landing. It responds to volume and to steady endurance riding, on a timescale of weeks, not days.
Read drift as your durability. A drift trend that falls across a block of long rides means you are holding form deeper into the session. Rising drift across several long rides — with everything else stable — usually means heat, under-fuelling or accumulated fatigue before it means lost fitness.
So check those three before you conclude anything about fitness. Heat first: a warm day pushes drift up on its own, and a rider who has spent two weeks training in the heat drifts less than the same rider in week one. Fluid and fuel second: on anything past 90 minutes, drinking too little and running low on carbohydrate both raise heart rate at unchanged power, and they usually arrive together. Pacing third: a first hour ridden too hard is drift you pay for in the third. Only when all three are ruled out does a rising drift trend say something about your endurance.
Do not compare your efficiency to a friend's. Watts per heartbeat depends on body mass, on maximum heart rate, on how you produce those watts. A 90 kg rider at 4.5 W/bpm and a 60 kg rider at 3.5 W/bpm may be equally fit. The comparison that means something is you against you, six weeks apart.
Do not fix what the number does not measure. Neither figure tells you whether your problem is aerobic capacity or glycolytic power. That question is VLamax's department, and it needs a proper test.
Where the model needs a real test
Efficiency and drift come free with every ride, and that is exactly their limit — they describe how your engine behaves, not what it is made of. To separate VO2max from VLamax you still need a defined protocol. Our power test does that from two efforts you ride yourself, no lab booking, and it is what anchors the VO2max values we correlated against above.
Both numbers are computed automatically for every activity you sync. You can watch them build a trend line while your training does the work.
Start your free trial — 30 days, full model, your own history.
One more thing
There is a third parameter in this model that we have barely touched here: the recovery time constant, how fast your heart rate falls when you stop pushing. We fitted it across 733 recovery segments, and it behaves differently from both numbers above — it seems to respond to freshness within days rather than fitness across weeks. That is a separate article, and a more speculative one.
FAQ
What is a good watts-per-heartbeat value? The median in our cycling data is 4.0 W/bpm, with the middle 90 % of athletes between roughly 2.6 and 5.4 W/bpm. But the value depends on body mass and maximum heart rate, so the useful comparison is against your own past, not against a table.
Is this the same as cardiac drift or decoupling? Drift and decoupling describe the same phenomenon — heart rate climbing over a long effort — but they are measured differently. Decoupling, called Pw:Hr for rides and Pa:HR for runs, compares the two halves of a session and is intended for steady efforts. We estimate drift inside a heart rate model that has already removed what power output explains, which means it stays defined on interval sessions too.
Why is my drift value different every ride? Because a single session's drift is genuinely noisy: its reliability is 0.21, which is low. Heat, fuelling and sleep all move it. Average ten sessions and reliability rises to 0.59. Read the trend across weeks, never a single day.
Do I need a power meter? For cycling, yes — the model needs power to separate what the effort explains from what it does not. For running we estimate power from GPS and pace, which is less precise: the original authors reported an error of 6 bpm for running against 4 bpm for cycling.
Does a higher efficiency mean a higher VO2max? Related, not identical. Across 200 athletes efficiency correlates positively with VO2max, but the relationship leaves plenty of room — the slope also carries body mass, maximum heart rate and cardiac stroke volume. If you want VO2max, measure VO2max.
Why not just use my heart rate average? Because average heart rate answers "how hard did that feel" and nothing else. Two rides at 145 bpm can differ by 60 watts. Efficiency puts the work back into the equation, which is the entire point.
How many rides before the numbers mean something? Ten sessions is the practical threshold — that is where efficiency reliability reaches 0.85 and drift reaches 0.59. We have measured exactly two points, one session and ten; everything between them is interpolation. So as a rule of thumb rather than a measured cut-off: a handful of rides is orientation, ten rides is a number you can train against.
Sources: de Smet, D., Francaux, M., Hendrickx, J., & Verleysen, M. (2016). Heart Rate Modelling as a Potential Physical Fitness Assessment for Runners and Cyclists. Machine Learning and Data Mining for Sports Analytics Workshop (MLSA), ECML-PKDD 2016, Riva del Garda, Italy. Friel, J., "Aerobic Endurance and Decoupling", coach blog article, for the decoupling method and its stated scope. Our own figures: 355,551 live activities for the distributions; 2,360 activities from 200 athletes, stratified, for the Pa:HR comparison; 400 activities re-fitted for the model comparison; 733 recovery segments for the kinetics; reliability throughout as intraclass correlation with bootstrap confidence intervals over athletes, 600 draws. Platform coverage: 1,166,119 of 1,743,367 activities carry fitted heart rate parameters. A Faster You data set: 1,202 athletes, 15,000+ power tests, 1M+ analysed training sessions.