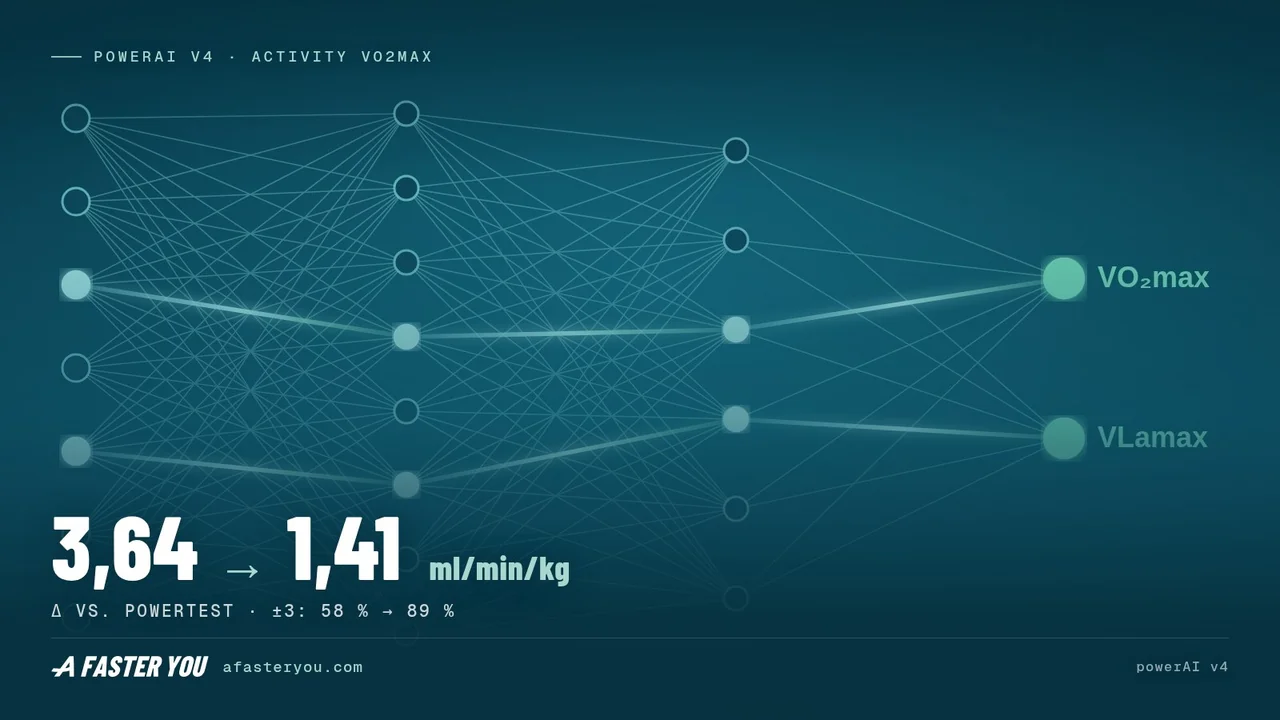
powerAI v4: Your VO2max, Calibrated to You (2026)
Your weekly VO2max moved this week — up two, or down three — and you didn't change a thing about your training. Here is what happened, with the numbers, and with the one sentence we owe you from July.
The sentence we owe you
When we introduced powerAI v3 in July, one section of that article ended like this: "On individual athletes, a newer approach is already showing even smoother curves — we are validating that across the board before we put numbers on it. No marketing deadline; we will name the date when we see it."
The date was 1 September. This is that post — and it has the numbers.
What v3 promised, and where it stopped
v3 was the leap from single readings to a curve. A neural network reads every ride you sync — power, heart rate, cadence, temperature, second by second — and estimates what your engine must look like to explain it. A Kalman filter then fuses those readings into the weekly value in your metabolic profile, calm when nothing happens, awake when something changes. That part worked, and still does.
But the v3 article also had a section called What v3 is not, and it was honest about one thing: for a few athletes, the curve ran cleanly but sat, as a whole, a step away from their true level. The fix existed — a Powertest calibrates the network to you, our digital twin — and the curve and the anchor lived side by side. The curve was calm. It was not always sitting on you.
That is the gap v4 closes.
What v4 changes
The twin, anchored to your test. With a valid Powertest, your curve is calibrated to that measured anchor. Without one, your curve follows your development from your own rides; the measured starting level comes with your first Powertest.
The anchor sits inside the curve. Since 1 September, the weekly value is built forward from your last valid Powertest. At the test boundary, the curve starts from the new test level and then moves as new rides arrive. A new test sets a new level — deliberately, in one step, instead of the curve drifting towards it over weeks.
The history, rebuilt. During the recomputation run from 1 to 6 September 2026, we rebuilt 750,525 historical activities and their weekly values for the affected curves, all with the same calibration — so a season curve is consistent from end to end.
The network itself is unchanged. The physics is unchanged. What changed is how the model is tied to you, and how its output becomes the number you see. The rest of this article is the evidence.
How closely does the displayed value track your Powertest?
One thing to keep straight first, because it decides what the numbers mean. There are two references here, and they answer two different questions.
The lab is the reference for the Powertest: 43 athletes with parallel spirometry, a mean bias — Powertest minus laboratory value — of −1.8 ml/min/kg, an average under-reading of 1.8, and a mean absolute error — the average size of the difference, regardless of direction — of 3.3. The full study is in Powertest accuracy. That is how good the test is.
The Powertest is the reference for the displayed value: for every eligible test series, what the model showed after the test against what the test said. That is this section. We keep the two apart and don't add their errors together — one measures the anchor, the other measures how well the curve holds onto it.
Two windows, because they answer different things. The "test week" is the first weekly value at least seven days after the test — and since v4 starts the curve from the test level, this window measures agreement with the anchor by design. The "90 days" window is the median of weeks two to thirteen, and it shows how well that agreement holds once new rides arrive. Both were measured on every test series whose last valid test lies before 1 June 2026 — 1,074 series across cycling and running — so that old and new display alike had thirteen weeks after the test to be judged on. Critical power (CP) is the modelled boundary between hard-but-sustainable and unsustainable effort; it is related to, but not the same as, FTP.
| Displayed VO2max vs. own Powertest | v3 | v4 |
|---|---|---|
| Mean absolute error, test week ml/min/kg | 3.64 | 1.41 |
| Median deviation, test week ml/min/kg | +0.19 | 0.00 |
| Within ±3 ml/min/kg, test week | 58 % | 89 % |
| Within ±5 ml/min/kg, test week | 75 % | 93 % |
| Mean absolute error, 90 days | 2.74 | 1.36 |
| Within ±3 / ±5, 90 days | 68 % / 83 % | 91 % / 98 % |
| Critical power, mean absolute error, test week W | 18.4 | 8.2 |
| Within ±10 / ±20 W, test week | 47 % / 68 % | 77 % / 90 % |
| Critical power, 90 days: within ±10 / ±20 W | 64 % / 79 % | 73 % / 93 % |
| Eligible test series | 1,074 | 1,074 |
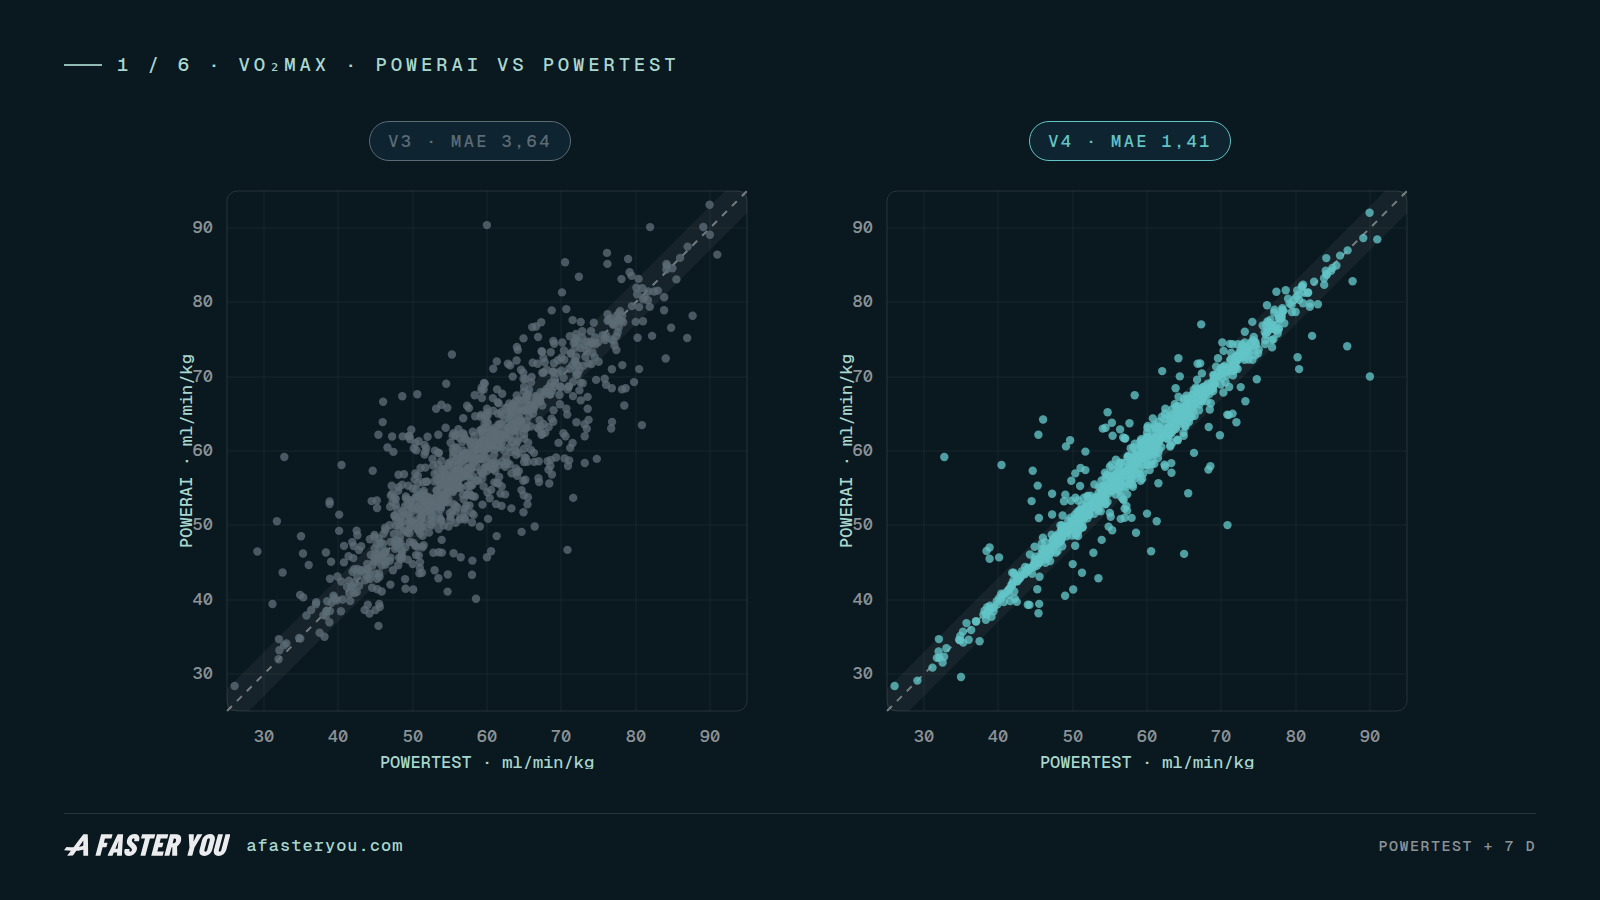
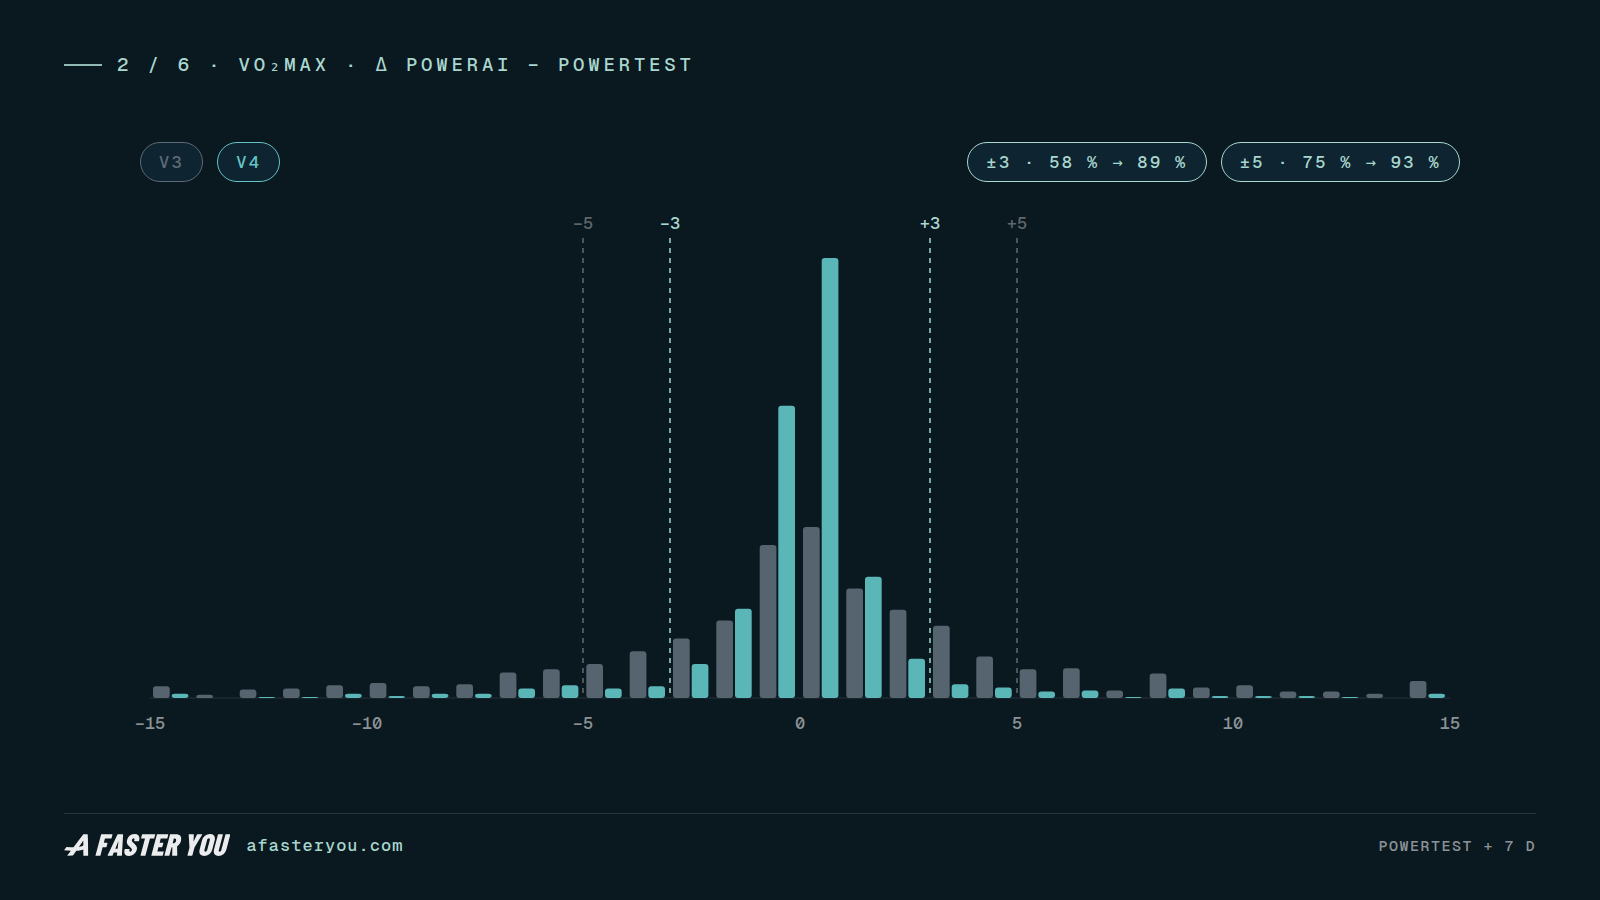
Reading the tails. Under v3, one test series in four sat more than 5 ml/min/kg away from its own test in the very week of the test. Under v4 it is one in fourteen — and after 90 days, one in fifty. The remaining distance is not the anchor slipping: it is the curve following the rides — or, in some cases, an input that changed after the test, such as a new maximum heart rate. Where an athlete builds or loses form after a test, the curve moves. That is what it is for.
The twin, tested before it went live
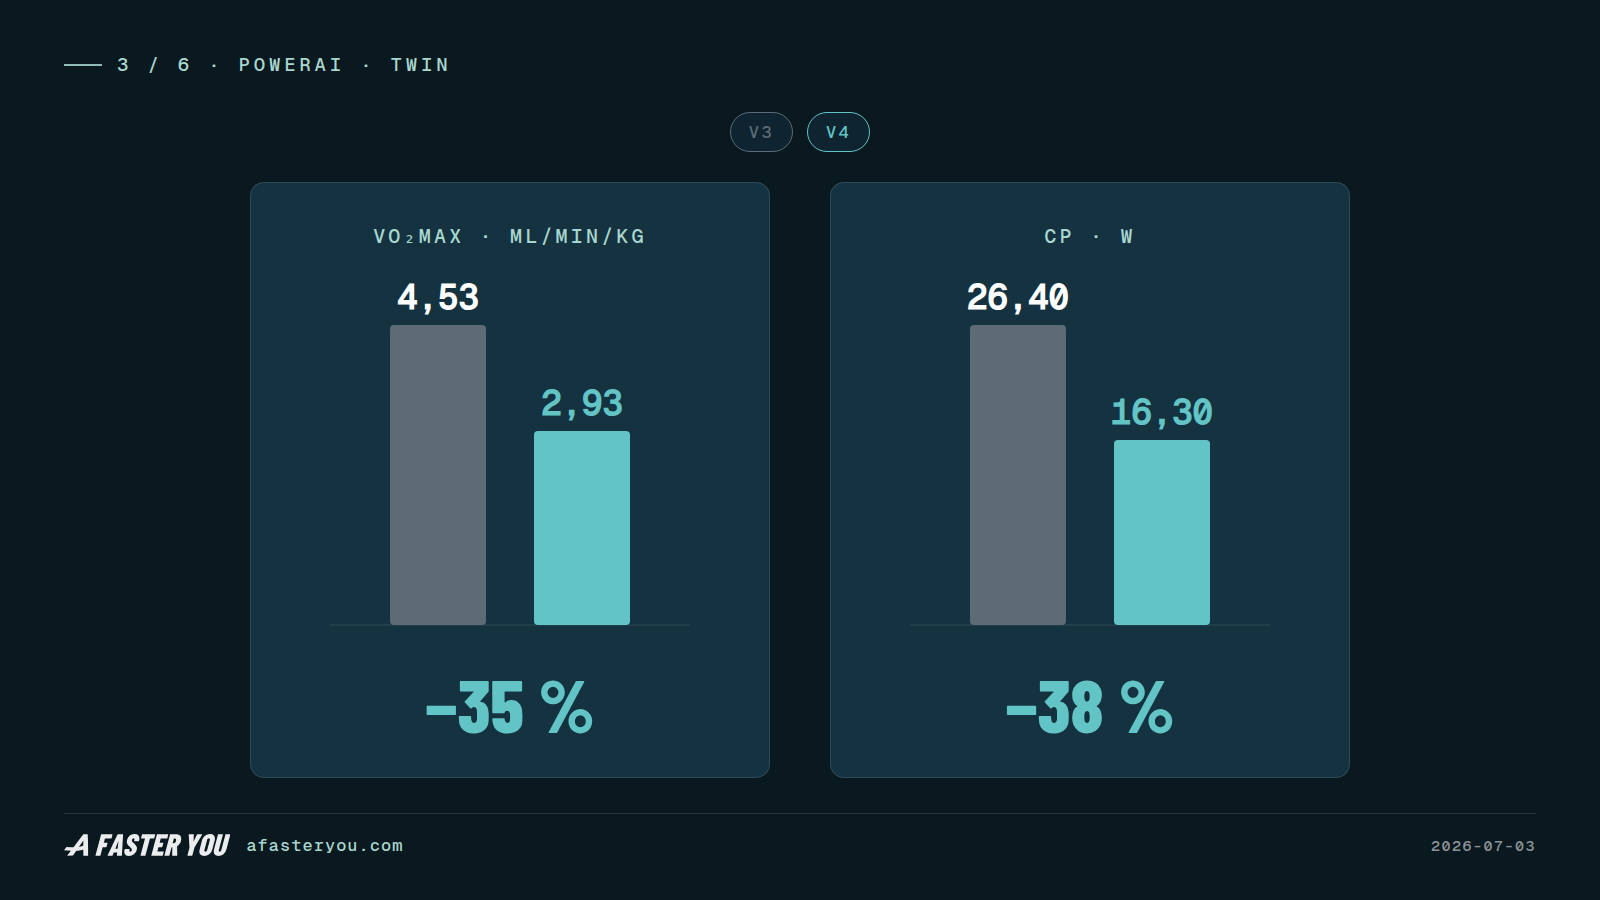
Before any of this reached your screen, the athlete-specific calibration was tested the way a model should be: against Powertests in gold quality — clean, complete, protocol-conform — that it had never seen. Against those held-out tests, the mean absolute error for VO2max fell from 4.53 to 2.93 ml/min/kg, 35 % less, and for critical power from 26.4 to 16.3 W, 38 % less. In the elite subgroup of that set, where generic models drift furthest from the truth, the gap closed by 52 % for VO2max and 74 % for CP — a smaller group, so read those two as the direction, not as the decimal.
That is the training-side evidence. The table above is what it looks like once it reaches your screen.
A calmer curve — measured on 2,060 season curves this time
The v3 article reported a week-to-week variation of 0.886 ml/min/kg. That number described the filtered curve — the model's internal estimate — on a validation grid. The numbers below use a different channel: the weekly value athletes actually saw, measured on the live population. They must not be compared directly. On the same filtered live channel, week-to-week variation moved from 1.03 with v3 to 0.97 with v4; on the displayed value, which in v3 carried an extra layer of calibration noise, the gain is larger.
For that displayed value we evaluated 2,060 eligible season curves from calendar weeks 10 to 35 of 2026, one result per curve. The median week-to-week movement fell from 1.23 to 1.00 ml/min/kg, and the share of curves containing at least one jump of four points or more fell from 36 % to 17 %. At 1,281 test boundaries, the median step fell from 3.3 to 1.8 ml/min/kg — and that remaining step is now deliberate: the curve starts from the newly measured test level instead of absorbing the test gradually over the following weeks.
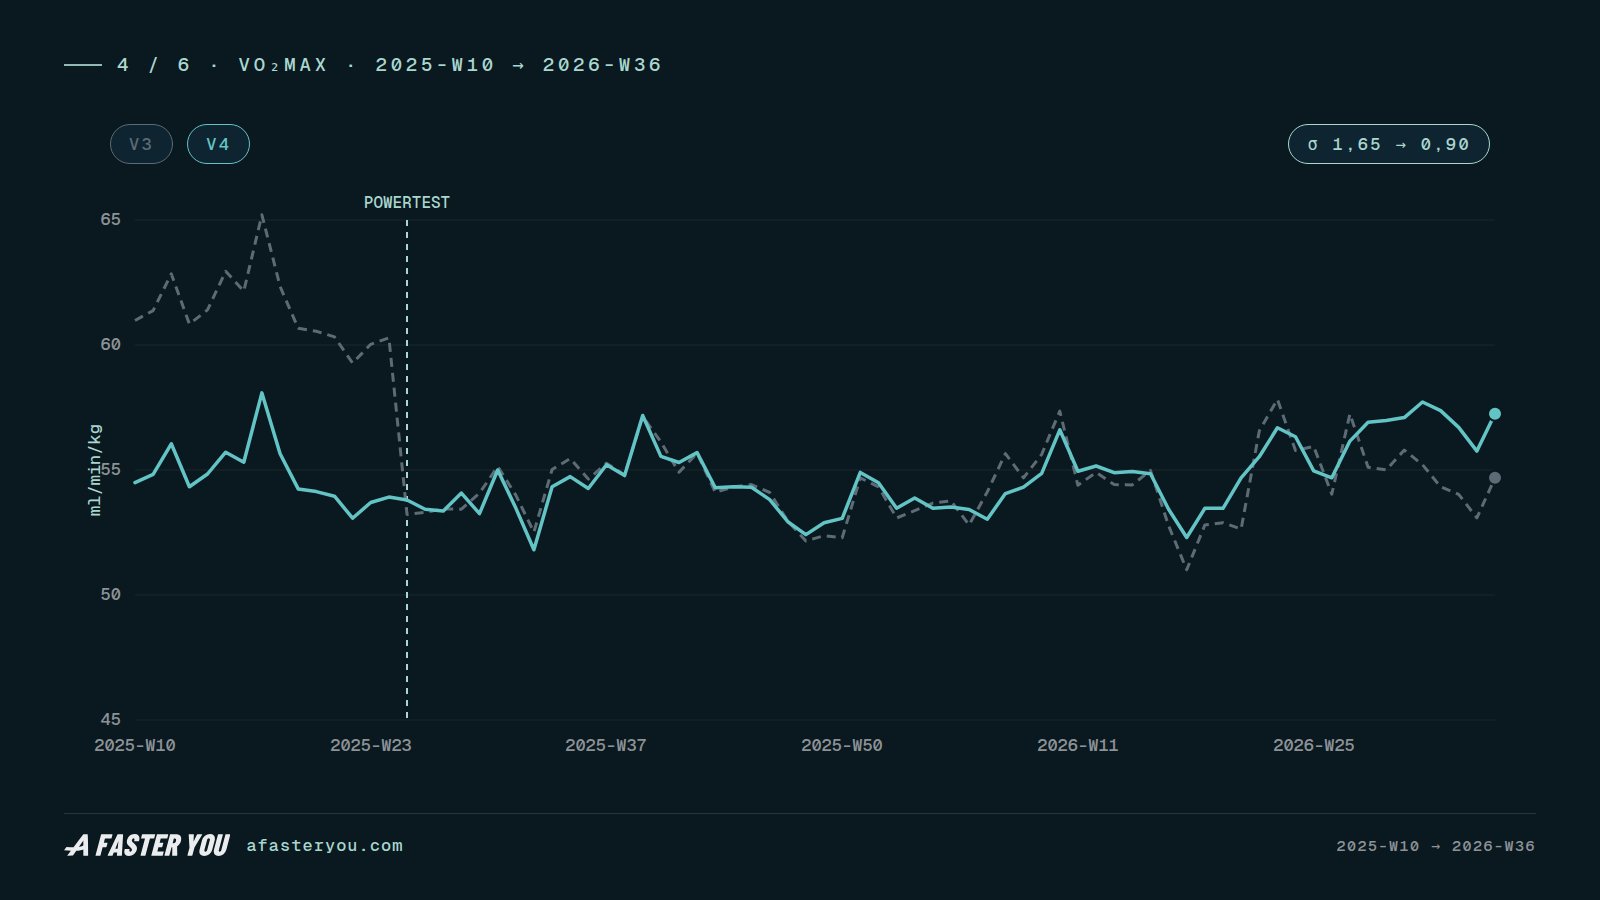
The season above is one athlete, chosen because nothing dramatic happens in it — which is the point. Before the test, v3 had the curve seven points too high; the test yanked it down. v4 stayed near the level the test later measured, and from there both versions follow the same rides — v4 with less jitter. One illustrative case; the distributions above and below are the actual evidence.
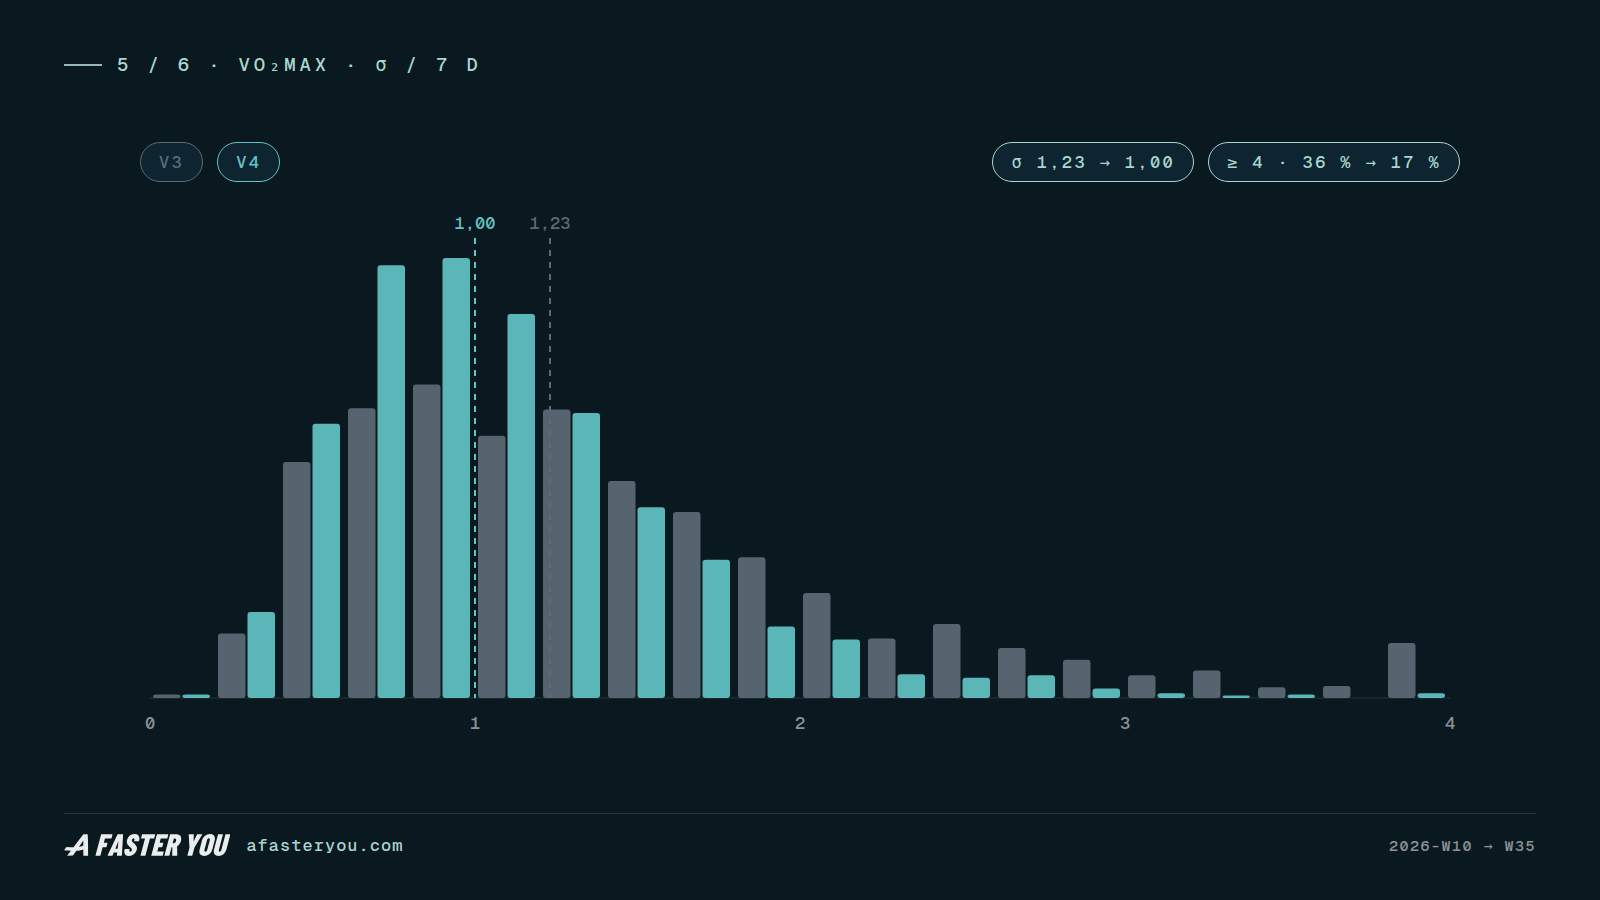
One thing v4 does not do: it does not make every week identical. About one in six season curves still contains a week that jumps by four points or more — typically after a block of very long rides, which the model reads with more confidence than it should. The mechanism is measured; how often it is the cause is not.
And a few things can still move a curve that have nothing to do with your fitness. Two of them we have measured: a second power meter on a second bike can read several points off — one athlete's SRM sat 3.5 points below his Quarq — and a new Powertest that shifts the model's maximum heart rate by ten beats leaves 43 % of curves more than 5 % away from their test, against 24 % otherwise. Two we have not isolated: heat and altitude. Several at once can amplify the visible effect. We would rather say so here than let you find it yourself — and all of it is on the list for version 5.
Checked against what athletes actually raced
Accuracy against a test is one thing. A displayed value can also be checked against something harder to argue with: the power an athlete has actually held in a race. Given the duration, the athlete's body mass and the model's conversion from power to oxygen demand, a raced power sets a lower bound on the VO2max that could have produced it. Under those assumptions, a curve below the bound would be inconsistent with the recorded performance.
On four professionals with usable race data, no displayed value sat below the bound their own racing had set. Four riders are not proof, and we have not repeated this check on the final state.
What you will see
This is the part that matters if you opened the app this week and found a different number.
Across 4,297 eligible season curves, 76 % moved by less than 4.5 ml/min/kg — one test-retest standard deviation of the Powertest itself. 12 % moved up by more than that. 12 % moved down. For critical power the picture is the same: across 4,198 curves, 75 % moved by less than 28 W, 12 % up, 13 % down. We use that standard deviation as a pragmatic threshold: a move inside it is small relative to how repeatable the test itself is, not proof that every smaller change is noise. Both directions are expected when a curve is re-levelled: a curve that was sitting above its level comes down, one that was sitting below comes up.
Where the change is larger than that, it has one of these causes. The diagnostics overlap and use different denominators, so the rows don't add up — they tell you which mechanism is most likely yours.
| Cause | Where it applies | What it means for you |
|---|---|---|
| Level correction for athletes without a test | the largest group; 27 % of these curves moved beyond the threshold | your curve follows your development from your own rides; a Powertest gives it a measured level |
| Anchor on your own test | 19 % of anchored curves moved beyond the threshold | your curve was sitting next to your test; the test now sets the level |
| Weeks rebuilt from older model versions | a small group | weeks that sat outside the current filter channel were rebuilt into the same curve |
| Body-weight correction | a small group of athletes | ml/min/kg recomputed with the weight actually on record for that period |
| Missing values filled | 2,887 activity records | rides that previously had no value now have one |
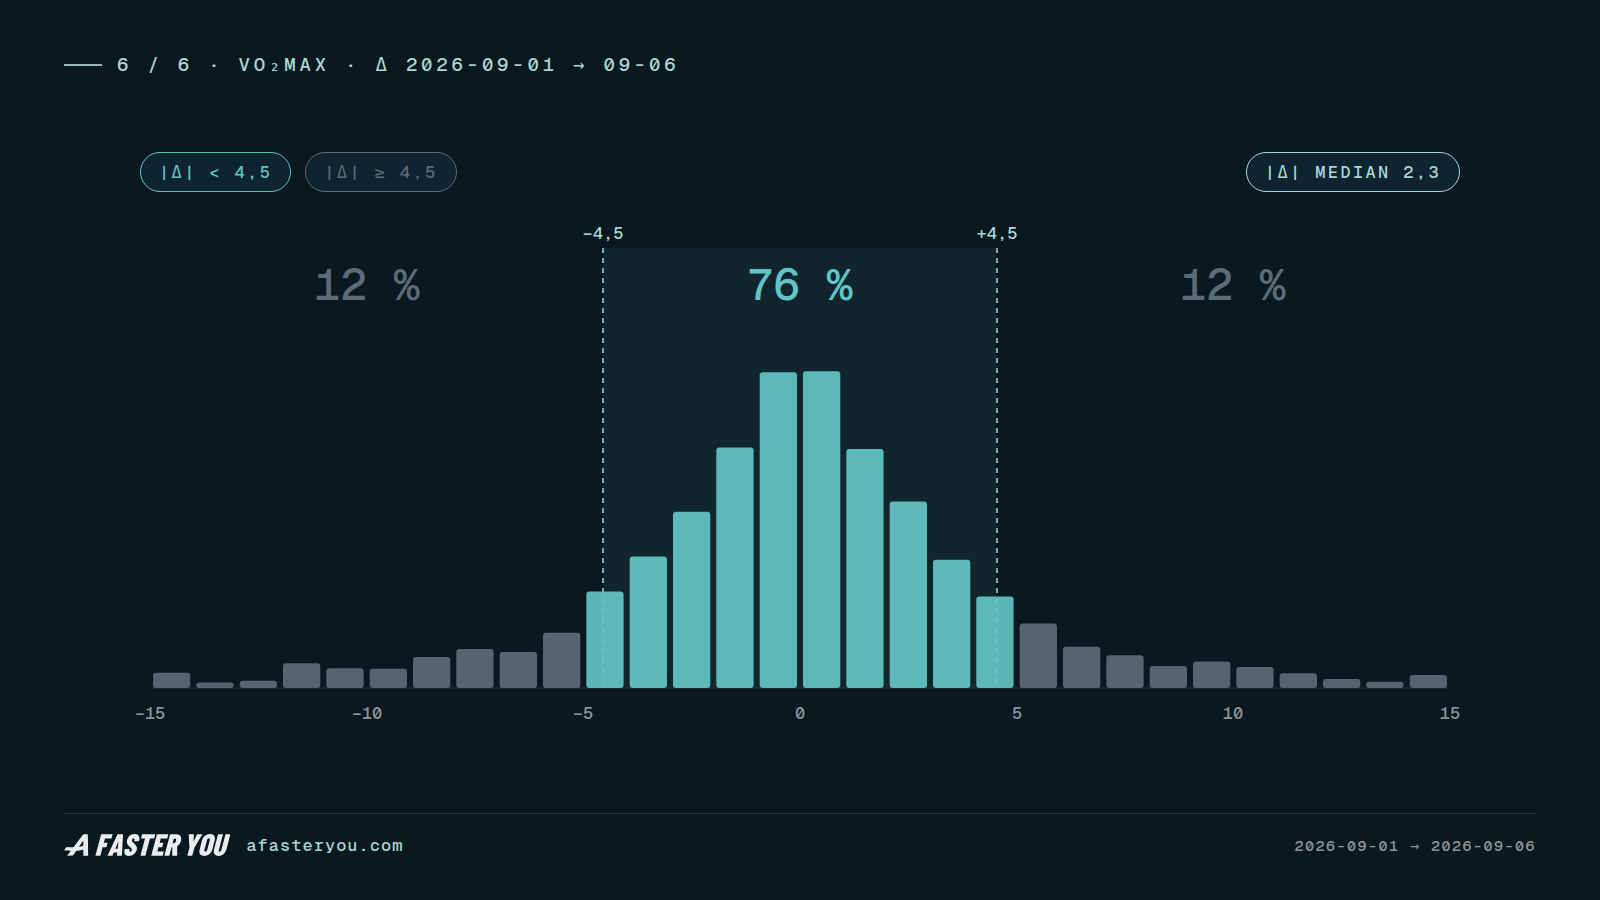
The typical move, where there was one, is 2.3 ml/min/kg — half the threshold. A move in either direction is the curve settling onto its calibration, or one of the corrections above — not fitness that appeared or vanished between 1 and 6 September.
How to check your own value
- Your Powertest is the reference. Open your metabolic profile. The weekly value should sit on your last valid test in the weeks after it and move from there.
- If your value moved by more than the threshold, the reason is one of the causes above. How much your training zones moved depends on what they are anchored to. Anchored to a valid Powertest, they run on measured watts, and the calculated boundaries shift by no more than 1.4 % across the full realistic range of the model's one conversion assumption (the calculation). In AI mode, or without a valid test, your zones are derived from the displayed value — and moved with it.
- Retest if your last test is old. The anchor is only as fresh as the test behind it. If your last test is older than about six months, a new Powertest sharpens the curve.
What comes next: v5
v3 gave you the curve. v4 put it on you. v5 is about the inputs that can still move a curve without a change in fitness.
Two of them are about your equipment: the offset between two power meters on two bikes, and the maximum heart rate the model works with — which today can shift with a new Powertest and takes the model's whole reading of your rides with it. In v5 there is one maximum heart rate per athlete, full stop.
Two are about the world you ride in: temperature and altitude. Both change what a given heart rate means, and both are on the list.
And one is about the model's own confidence: today it trusts a single long ride more than the scatter between rides justifies, which is where the remaining weekly jumps come from. Every one of these goes the same way as this update — measured against your own tests before anything reaches your screen. The laboratory cohort with MSH keeps growing; running economy and VLamax validation follow.
Methodology: how we measured this
| Activities rebuilt | 750,525 historical activities and their weekly values, recomputation run 1–6 September 2026 |
| Reference for accuracy | athletes' own valid Powertests — not the lab |
| Accuracy set | 1,074 eligible test series, last valid test before 1 June 2026; test week = first weekly value at least seven days after the test; 90 days = median of weeks 2–13 |
| Calm and jumps | 2,060 eligible season curves, calendar weeks 10–35 of 2026, weeks present in both versions; one value per curve. Filtered channel: 2,021 series |
| Test boundaries | 1,281 anchor-eligible tests from 2025 onward, weeks within 28 days of the test in both versions |
| Change distribution | 4,297 eligible season curves, last week present in both versions, v4 minus the 1 September values |
| Held-out definition | Powertests in gold quality withheld from training, run ledger 3 July 2026; error metric: mean absolute error |
| Threshold | one test-retest standard deviation of the Powertest: 4.5 ml/min/kg, 28 W |
| "Before" snapshot | live weekly values of every curve in the recompute, 1 September 2026 08:01 UTC, checksum 248c8a65… |
Two references, kept apart. The lab validates the Powertest — 43 athletes, in Powertest accuracy. The Powertest validates the displayed value — this article. The calibration gains of 35 % and 38 % were measured against held-out Powertests in gold quality, never against the lab. Every recomputed-history figure comes from a repeatable read-only query on the production database, stored with its checksum; the laboratory, held-out and training-zone results come from the separately named studies.
FAQ
Why did my VO2max move up or down? Because your curve had been sitting above or below your test and v4 now holds it there, because its level was re-set, or — less often — because a body-weight or missing-value correction changed the ml/min/kg. Check your last Powertest: the weekly value should sit on it. The move is the curve settling, not fitness that appeared or vanished this week.
Did the AI model change? No. The network that reads your rides is unchanged. What changed is how the curve is tied to you — anchored to your Powertest if you have one — and the display layer that turns readings into a weekly value.
Is my Powertest still valid? Yes. It is the anchor everything above is calibrated to. If it is older than about six months, a new one sharpens the curve.
Do my training zones change? Anchored to a valid Powertest: by no more than 1.4 % at the calculated boundaries; the rest is rounding. In AI mode, or without a valid test, your zones follow the displayed value and moved with it — a new Powertest puts them back on measured watts.
How accurate is the displayed value now? Against athletes' own Powertests: 1.4 ml/min/kg mean absolute error in the test week, 89 % of test series within ±3; over the following 90 days 91 % within ±3. The test itself sits within 3.3 of the lab on average.
My value still jumps from week to week. Why? Most often a block of very long rides: the model reads them with more confidence than the scatter between rides justifies, and the weekly value follows. About one in six season curves contains such a jump. A second power meter, a Powertest that moved your maximum heart rate, heat or altitude can add to it. Calibrating the ride confidence and taking those inputs out of the curve is what v5 is for.
I've never done a Powertest — does this affect me? Yes. If your synced rides carry power and heart rate together, the model reads them and builds your curve — 98.2 % of athletes without a test have one. It follows your development from your own rides. What it doesn't have is a measured starting level: a Powertest sets that, and from then on your curve starts from your measured value.
Sources: Mader, A. & Heck, H. (1986) — Int J Sports Med, 7(Suppl 1):45–65. Mader, A. (2003) — Eur J Appl Physiol, 88(4–5):317–338. Kalman, R.E. (1960) — J Basic Eng, 82(1):35–45. Calibration held-out results: powerAI run ledger, 3 July 2026 (mean absolute error). Recomputed-history figures, including the filtered-channel week-to-week variation: internal numbers file of 6 September 2026, every value from a repeatable read-only query against the production database, stored with its checksum. Curve coverage without a test: production database, 6 September 2026. Powertest-vs-lab validation: 43 athletes, MSH Medical School Hamburg cohorts 2022/2025 — see Powertest accuracy. v3 week-to-week variation: powerAI v3 article, July 2026. Platform basis: 15,000+ Powertests, 1M+ analysed training sessions.