Zwift FTP Test: Spot-On for Most — Make Your 300 W Personal
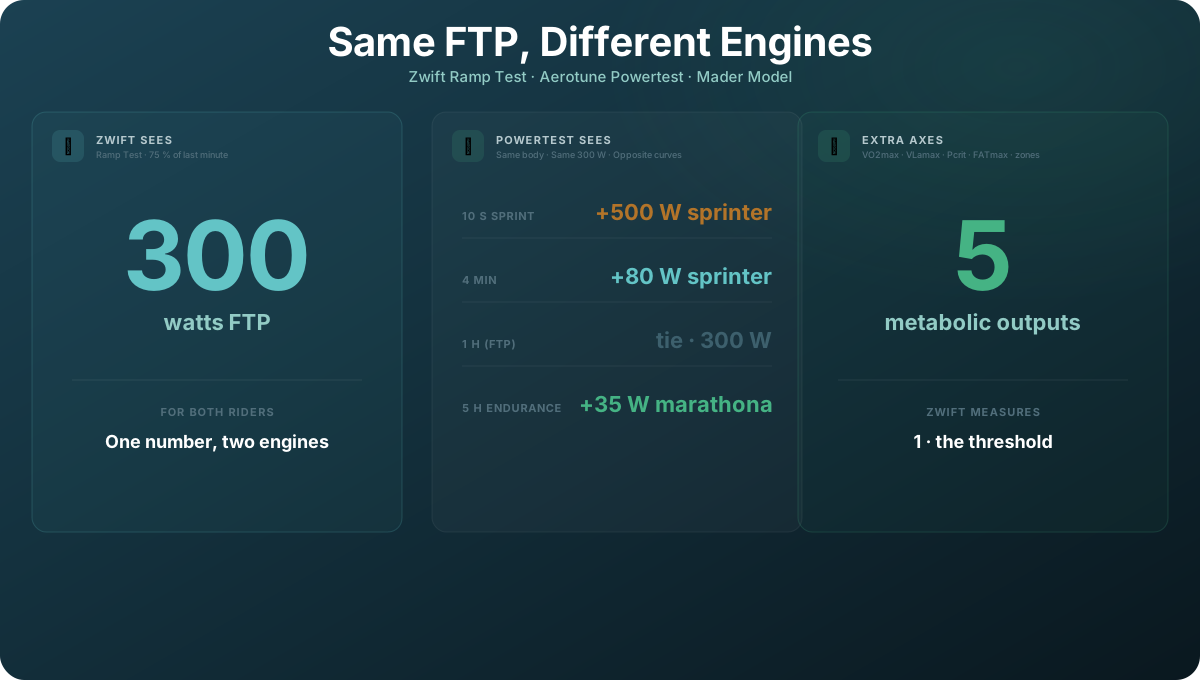
Two riders end their ramp test two watts apart: 397 and 399 W in the final minute. Zwift's rule turns that into an FTP of 298 and 299 W. Same number, near enough.
What they can actually hold for an hour differs by 37 watts — 322 W against 285 W. Both are real athletes on our platform, each with a Powertest history behind them, not a single lucky evening. No estimator that reads the ramp alone can tell them apart, because the gap between ramp power and hour power isn't a property of the test. It's a property of the athlete.
This article puts two tests side by side: the Zwift FTP test and the A Faster You Powertest. Both run in your normal trainer setup. Both finish inside a single ride. They answer two different questions — and below, we check Zwift's conversion rule against 1,818 of our own ramp tests.
What Zwift's FTP tests actually measure
Zwift gives you three protocols, all of them designed to land you at one number — your Functional Threshold Power, the wattage you can theoretically sustain for an hour.
| Test | Duration | Conversion factor | What it tells you |
|---|---|---|---|
| Standard FTP Test | 45 min | 95 % of 20-min avg | One number: FTP |
| Ramp Test | ~20 min | 75 % of last full minute | One number: FTP |
| Ramp Test Lite | ~20 min | 75 % of last full minute (smaller steps) | One number: FTP |
That's its strength: you finish a Zwift FTP test with one clean, repeatable watt value that sets your ERG targets. The interval intensities, zone boundaries and weekly volume built on top of it come from standard percentages — and that's where a metabolic profile can make them even more personal.
What Zwift's 75 % rule gets right — and where your own factor differs
Here's the part most comparisons skip: this is checkable. Not Zwift's implementation — we have no Zwift measurements, and we won't pretend otherwise. What we can check is the conversion rule, against ramp tests that follow the same protocol: +20 W per minute, referenced to the last full minute. We pulled 1,818 cycling ramp tests at our highest data-quality rating and compared Zwift's 0.75 factor to each rider's measured hour power.
The headline result speaks for Zwift:
| Measured across 1,818 ramp tests | |
|---|---|
| True conversion factor, mean / median | 0.753 / 0.755 |
| Mean deviation of Zwift's fixed 0.75 | 1.4 W (slightly low) |
| Real spread, 5th–95th percentile | 67.0 % – 83.1 % |
| Riders off by more than 5 % | 40 % |
| Full range of the deviation | 58 W too low to 60 W too high |
Zwift's 0.75 is a good number. Across our cohort it lands within a watt and a half of the truth on average. The rule is calibrated to the average cyclist, and the average cyclist in our data has a VLamax of 0.51 — almost exactly the value at which 0.75 is correct.
Nobody trains as the average. The same rule that is right to within a watt and a half on the mean is off by more than 5 % for two riders in five, and the tails run from a 58-watt underestimate to a 60-watt overestimate. Whether you sit at 67 % or at 83 % is not noise and not a bad day. It is a stable, measurable property of your metabolism — and the next two sections show which property.
Two more things worth knowing about any single-number test:
The 20-minute test demands pacing skill. It's more accurate for experienced riders, but it rewards the cyclist who has already done dozens of all-out 20-minute efforts. First-timers either blow up at 8 minutes or sandbag the last five.
A ramp result is a strong starting point. Zwift's tests give you a dependable number for your ERG targets, a solid first FTP and a clean trend over months. The next step — interval intensities tuned to your metabolism — is where a Powertest adds the personal layer.
What an A Faster You Powertest adds on top of your Zwift FTP
The A Faster You Powertest follows the Mader protocol. In one session — about 90 minutes including warm-up and cool-down — you complete three timed efforts:
- 10 seconds, all-out — surfaces your glycolytic capacity (VLamax)
- A ramp test to exhaustion — surfaces your peak aerobic power (VO2max)
- A 12-minute time trial at maximum sustainable power — anchors your threshold and critical power
Combined with your body weight, body fat, and the Mader equations, the system extracts five physiological parameters in one pass:
- VO2max — your aerobic ceiling (ml/min/kg)
- VLamax — your maximum lactate production rate (mmol/l/s)
- Pcrit — your critical power, which approximates FTP for most riders
- FATmax — the wattage where fat oxidation peaks
- Training zones specific to your metabolic profile — one step more personal than a percentage table
The 12-minute effort alone gets you to a number Zwift would call FTP. The 10-second sprint plus the ramp gets you to the engine that produced that number. Those are different facts about the same ride.
Same FTP, opposite athletes — the case study
These are not sample profiles. Two real Powertests from our platform, picked because their ramp tests finished two watts apart — and because both riders have a test history behind them.
| Athlete A | Athlete B | |
|---|---|---|
| Ramp test, final minute | 397 W | 399 W |
| Zwift FTP (× 0.75) | 298 W | 299 W |
| VLamax | 0.32 mmol/l/s | 0.75 mmol/l/s |
| W′ per kilogram | 188 J/kg | 346 J/kg |
| VO2max | 55.3 ml/min/kg | 59.3 ml/min/kg |
| FATmax | 227 W | 181 W |
| Power held for one hour | 322 W | 285 W |
Thirty-seven watts apart at the same test performance. Zwift's rule puts Athlete A 24 W below what they can actually hold, and Athlete B 14 W above it. Same protocol, same kind of trainer, two watts between them on the test itself.
Neither of them is a single-day snapshot — that's why we picked this pair. Athlete A has seven valid Powertests spread over two years, body weight steady within 1.5 kg: hour power between 322 and 337 W every time, and every time above 77 % of the ramp minute — never once down at Zwift's 75 %. Athlete B has three tests over a little more than three months, body weight steady within a kilogram, and never once above 75 %. Neither rider is having a bad day. They sit on opposite sides of the same rule, and they stay there.
Now put both on the same plan. A threshold interval at 95 % of FTP sends Athlete A out at 283 W and Athlete B at 284 W — the same watts, near enough. For A that is 88 % of their real threshold: honest tempo, and not the session that was prescribed. For B it is 100 %: their limit, every repeat, all block long.
Now read the VO2max row again. Athlete A has the lower aerobic ceiling and the higher sustained power. Judge these two by VO2max alone — the number your watch tracks so well over time — and you'd rank them the wrong way round for hour power. The ceiling tells you how high the engine revs. It says nothing about how long it runs there.
The difference is fuel. Athlete A's fat oxidation peaks at 227 W; Athlete B's peaks at 181 W. Above that point, B pays in glycogen for every additional watt — and at a VLamax of 0.75, more than twice A's rate, the price is steep. Same ride, same watts on the screen, two different tanks emptying at two different speeds.
Why this matters for your training plan
Here's the part that costs you weeks, and it has nothing to do with the number on the screen.
Your plan prescribes a threshold interval at 95 % of FTP. Sound, standard, coach-approved. Now watch what that single instruction actually does across our 1,818 ramp tests (from 1,014 athletes), grouped by their Mader-model VLamax:
| VLamax group | Tests | True conversion factor | A "95 % of FTP" interval lands at |
|---|---|---|---|
| below 0.30 — diesel | 150 | 0.832 | 86 % of true threshold |
| 0.30 – 0.40 | 251 | 0.792 | 90 % |
| 0.40 – 0.50 | 476 | 0.768 | 93 % |
| 0.50 – 0.65 | 521 | 0.742 | 96 % |
| 0.65 and above — sprinter | 420 | 0.696 | 102 % of true threshold |
Read the two ends of that table as two athletes on the same plan, on the same evening, both executing it perfectly.
The diesel rides the intervals at 86 % of their real threshold. That's honest tempo work. It is not a threshold session — the stimulus the session was designed to deliver never arrives. Six weeks later the numbers haven't moved and the rider concludes they're a non-responder.
The sprinter rides the same session at 102 % — above the line, every single repeat. At a VLamax of 0.7 they're also burning glycogen at a rate the diesel never approaches. They finish the block flat, sleep badly, and call it overtraining.
Neither of them made a mistake. Both followed the plan to the watt. The watt was the problem — and no amount of discipline exposes it, because the number on the screen looks correct the whole way through. This is the failure mode nobody debugs, because there's nothing visibly broken to debug.
That's the case for determining your VLamax instead of assuming it. Not because 300 W is wrong, but because 95 % of which 300 W decides whether your next six weeks do anything at all.
The Powertest runs automatically inside your training plan
If you've connected Zwift to your A Faster You training plan (the full sync walkthrough covers the 14-screen flow), there is nothing manual to set up. When your plan calls for a Powertest, the workout pushes itself to Zwift Companion. You ride it. The finished activity flows back. The Mader analysis runs automatically and your full profile — VO2max, VLamax, Pcrit, FATmax, and zones — lands in your dashboard within seconds. No file download, no FIT upload, no FTP-setting workaround. The integration handles the percentage-target mapping in the background.
The Powertest itself is a single workout, ridden indoors or outdoors:
- 20 min warm-up at conversational pace
- 10 seconds, all-out from a standstill — the VLamax surface
- 10 min easy recovery
- 5–45 min ramp — women start 60 W, men 80 W, +20 W every minute, to exhaustion — the VO2max surface
- 30 min recovery
- 12-min time trial at maximum sustainable power — the threshold anchor
- 10 min cool-down
Total ride time: roughly 90 minutes. Repeat at least once a year — more often is better; every eight to twelve weeks in a training block is a good rhythm. Each test re-tunes your zones, your intervals, and your fuelling targets to the engine you actually have today.
For athletes who prefer fresher legs on each effort there is a two-day version (ramp day one, time-trial day two), an outdoor version (no ramp, 4-min + 12-min instead), and a lactate-sampling version that adds blood-lactate readings for laboratory-grade accuracy. All three run through the same training-plan integration.
What Zwift's Ramp Test does best — and when to go one step further
A Zwift Ramp Test is a clean maximum-aerobic-power test with a 0.75 factor. Our data says that multiplier is well chosen: across 1,818 ramp tests the true factor averages 0.753. The same data says the factor only describes you if your VLamax sits near the middle of the range. Between the 5th and the 95th percentile of our cohort the real factor runs from 67 % to 83 %, and where you land in that band is set by your metabolism, not by how hard you tried.
Where the Ramp Test is the right tool:
- Setting your ERG targets and a first FTP — a standardised protocol gives you a dependable number in about 20 minutes.
- Tracking your own trend. Whatever your personal conversion factor is, it's stable. A ramp result that climbs 15 W over a block means something real, even if the absolute number is off.
Where a Powertest takes it further:
- For your personal hour power. Functional Threshold Power, by its original definition, is the highest power you can hold for one hour. There are two direct ways to get there: ride all-out for an hour, or build it from the underlying physiology — critical power and W′, driven by VO2max and VLamax. A fixed factor is right for the average rider — and our data show it is. The Powertest adds your personal factor.
- As a basis for individual training prescription. Two riders with the same ramp number can differ by 37 watts in what they hold for an hour. That's the case study above — and it isn't the extreme case in our data.
The fair framing: the Ramp Test answers "what's my FTP for this block, quickly and repeatably" — and answers it well. The Powertest answers "what is my body's actual threshold, and which intervals will move it". Two good tools, two questions.
Methodology: how we built these tables
We have no Zwift measurements. We did not test Zwift's implementation and cannot. What we tested is Zwift's conversion rule, applied to ramp tests that follow the same protocol.
For this analysis we applied the strictest standard our database allows:
| Step | Tests | Why |
|---|---|---|
| Powertests on the platform | 15,000+ | the data base |
| of those, at test quality | almost 9,000 | only tests that completed the protocol fully and without anomalies — internal test accounts and aborted recordings excluded |
| cycling ramp tests on Zwift's protocol | 1,818 | +20 W per minute, one uninterrupted single recording per test, and every field in these tables populated — no gaps, no imputation |
As of August 2026.
- Ramp reference: the last full minute of the ramp at +20 W per minute — the same step size and the same reference point Zwift uses. That is the measured value; everything else in these tables is derived from it, not the other way round.
- True hour power: the two-parameter model of critical power (Pcrit) and anaerobic work capacity (W′), evaluated at 3,600 seconds. Both parameters come out of the Powertest, not out of the ramp alone. Since August 2026 every test protocol runs on the same accounting: W′ carries the lactic capacity, and the creatine-phosphate store is tracked separately on the power-duration side instead of being folded into W′.
- Model-free cross-check: if this were an artefact of our model, it would disappear in raw measurements. It doesn't. The measured 12-minute time trial divided by the measured ramp power falls monotonically across the VLamax groups — 0.876, 0.847, 0.829, 0.811, 0.777. Nothing in that ratio is modelled; both numbers are watts a rider actually produced.
- Which parameter carries the effect: VLamax explains the deviation better (r = −0.86) than W′ per kilogram does (r = −0.73), and the two are tightly coupled (r = 0.96). The ordering matters — W′ is the energetic consequence of a high lactate production rate, not its cause.
- Conservative by construction: our ramp starts at a fixed 60 W (women) / 80 W (men) and runs longer than Zwift's. Less pre-fatigue would push the final minute higher, which makes the overestimation for high-VLamax riders larger than what we measured, not smaller.
- Group sizes are printed in every table. No bucket carries fewer than 150 riders.
The Powertest layers on top — it doesn't replace your Zwift workflow
If you already ride Zwift, the A Faster You Powertest doesn't ask you to leave. It asks for 90 minutes at least once a year — more often is better, ridden as a Zwift workout, analysed automatically afterwards. The remaining hundreds of hours of training stay exactly where they are — in Zwift, with your A Faster You workouts pushed to Companion (here's the full sync walkthrough).
What the Powertest adds: intervals calibrated to your actual physiology, built by the Mader model specifically for your VO2max-VLamax profile.
Try the Powertest — included in your 30-day free trial
The A Faster You Powertest and the AI training-plan are unlocked together. Connecting Zwift inside the training-plan editor starts a 30-day Premium trial — no credit card — and your first Powertest can be ridden the same week. After the trial you decide whether to keep Premium, but the metabolic profile you measure stays with your account either way.
Connect Zwift and start your first Powertest →
For the full integration walkthrough, see How to sync your A Faster You AI training plan to Zwift. If you want to understand the VLamax side of the engine before you ride the test, VLamax Explained is the prerequisite reading.
FAQ
How does the Zwift Ramp Test compare with the A Faster You Powertest? On average, remarkably well: across 1,818 of our own ramp tests, the true conversion factor averages 0.753, so Zwift's fixed 0.75 is an excellent average. What the Powertest adds is the individual view — 40 % of tests sit more than 5 % away, and the direction is predictable: riders with a high VLamax get overestimated, those with a low VLamax underestimated. Without your VLamax you can't know which side you're on, or by how much. Your personal distance from 0.75 needs a second number: the Powertest computes a Mader-model VLamax from your sprint to individualise it. And to be precise: VLamax is never measured directly — not even in a lab, where it is still derived from a maximal sprint plus blood-lactate samples, extrapolated over the muscle's water volume and the lactate exchange between muscle and blood. Every method reports a model VLamax; we compute the Mader-model value. The same Powertest data then model your VO2max, VLamax, Pcrit and FATmax in one ride.
Does that mean Zwift's Ramp Test is wrong? No. Zwift's rule is calibrated to the average cyclist and it hits that average within about a watt and a half. The problem isn't the rule, it's that nobody trains as the average. For tracking your own trend the Ramp Test does its job well — and FTP-test results set your workout targets, while your race category runs on Zwift Racing Score, not the FTP test.
Do I need a power meter or smart trainer? Yes — both tests need accurate watts. Any Zwift-compatible trainer that produces power data works for the Powertest, exactly as it does for the Ramp Test.
How often should I retest? At least once a year — more often is better; every eight to twelve weeks during a training block is a good rhythm. That's the cadence at which a structured plan produces measurable metabolic change, and it's frequent enough that the model can re-tune your zones.
Can I do both tests on the same day? No — both are maximal efforts and need fresh legs. The training-plan AI schedules the Powertest with appropriate spacing from other hard sessions, so you don't need to plan it yourself.
Does the A Faster You Powertest replace lab testing? Not quite — the gold standard is still lab spirometry plus blood-lactate sampling. How close the Powertest gets is measured, not estimated: across 43 lab-validated athletes the mean bias is −1.8 ml/min/kg and the typical single-test error 6.2 % (the full validation) — reached with nothing but your trainer and the Mader equations. For most amateur and many elite athletes the accuracy is more than enough; for performance-diagnostics centres, A Faster You offers a lactate-protocol version that integrates blood lactate readings.
What if I don't have Zwift? The Powertest also runs on outdoor rides and on any trainer app or head unit that records a FIT file. Zwift is the most popular home for indoor riders — and our indoor integration — so that's where the workflow is built out the most. The protocol and the analysis are platform-independent.
Cohort data: 1,818 validated cycling ramp tests from 1,014 athletes in the A Faster You Powertest database, top data-quality rating, as of August 2026; conversion factor computed against critical power and W′ evaluated at one hour. Mader protocol references: Mader (2003), European Journal of Applied Physiology; Mader & Heck (1986), International Journal of Sports Medicine. Functional Threshold Power concept: Allen & Coggan, "Training and Racing with a Power Meter" (3rd ed., 2019). Zwift FTP test protocols: ZwiftInsider FTP Tests overview (2026).