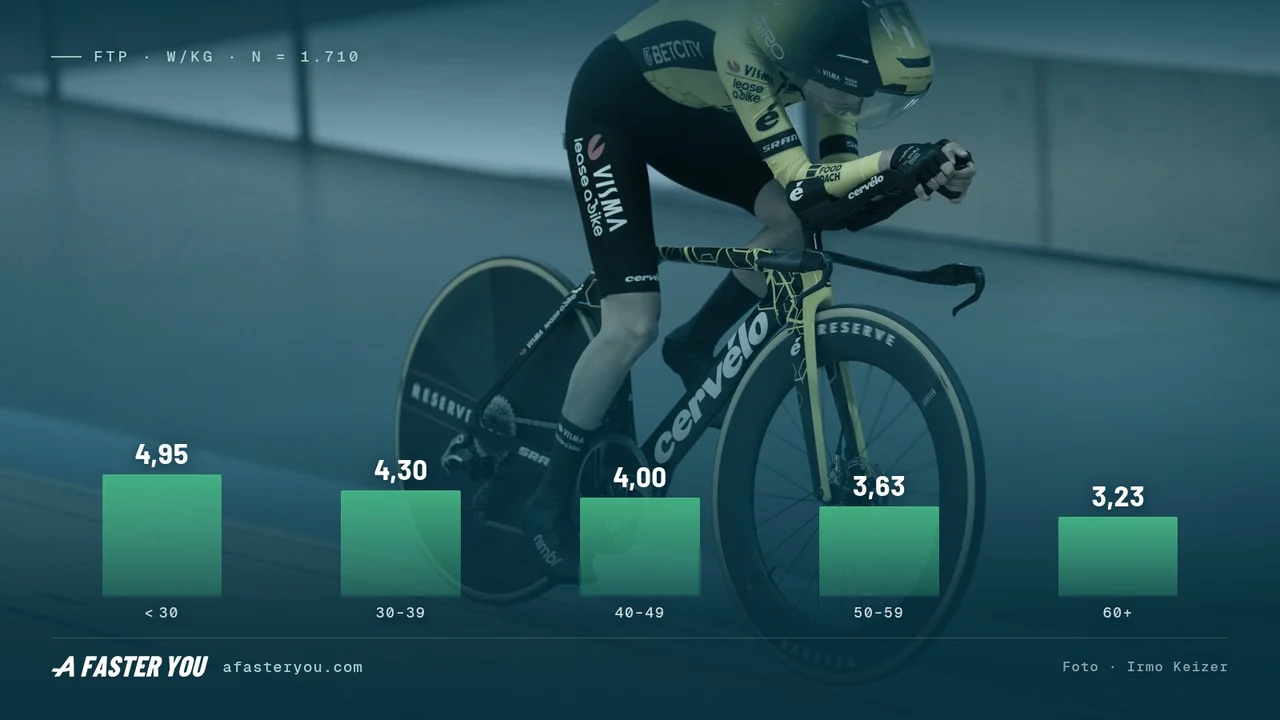
FTP by Age Chart: Watts per Kg (1,710 Riders)
Your power meter says 250 watts. Good for a 47-year-old? No reference table existed. So we built one from 1,710 riders.
Short answer, men's medians: 4.95 W/kg under 30 · 4.00 W/kg at 40–49 · 3.23 W/kg at 60+. For women: 4.07 W/kg under 30, 3.48 W/kg from 40 up. Full tables, sample sizes and the method behind them below.
You can look up VO2max norms in seconds — ACSM and the Cooper Institute have published them for decades. Look up what watts per kilo is normal for your age, and you find forum posts, coaching anecdotes and a lot of confident guessing. The tables below are the other thing: measured power data from riders who tested with us, split by age and sex, with the sample size on every single row.
What "watts per kilo" actually is
Your threshold power is roughly what you can hold for an hour before the metabolic bill comes due. Divide it by your body weight and you get watts per kilo — the number that decides whether you stay with the group on a climb.
Raw watts move you through air. Watts per kilo move you up hills. A 90 kg rider at 300 watts and a 60 kg rider at 200 watts have the same 3.33 W/kg and will climb side by side, while the heavier rider drops the lighter one on every flat. That is why the cycling world talks in W/kg and why a chart of raw watts alone would tell you very little.
One thing up front, because it matters for how you read these numbers. We do not measure your threshold with a blood lactate test in a lab. Your power meter measures watts — that part is a hardware measurement. The threshold itself is derived from those watts through the Mader model, the same metabolic model that underpins our Powertest and training zones. So: measured power, modelled threshold. Every FTP from a bike ride — ours included — is measured watts plus a model; we just say which part is which.
FTP by age chart — men
Median and top-10 % threshold power in watts per kilo, one value per athlete, best valid test:
| Age | n | Median W/kg | Top 10 % |
|---|---|---|---|
| under 30 | 404 | 4.95 | 5.77 |
| 30–39 | 526 | 4.30 | 5.59 |
| 40–49 | 352 | 4.00 | 4.88 |
| 50–59 | 173 | 3.63 | 4.38 |
| 60+ | 62 | 3.23 | 4.18 |
Read the median as the middle of the field: half of the riders in that band are above it, half below. The lower quarter of the 40–49 band starts at 3.49 W/kg, the lower quarter of the 50–59 band at 3.27 W/kg. To place a single number: on the median you are mid-field for your age, in the top-10 % column you are in the strongest tenth of it. There is no absolute pass mark — the same 3.5 W/kg sits just under the median at 50–59 and well below it at 30–39.
FTP by age chart — women
Same metric, one value per athlete — median and top-10 % threshold power in watts per kilo:
| Age | n | Median W/kg | Top 10 % |
|---|---|---|---|
| under 30 | 64 | 4.07 | 4.79 |
| 30–39 | 79 | 3.57 | 4.68 |
| 40 and older | 50 | 3.48 | 4.21 |
Why the women's table has three rows and the men's has five. Because that is what the data supports. Of the 1,710 riders in this cohort, 193 are women. Split by decade, everything from 40 upward falls below our reporting threshold of 30 athletes per row — 29 riders in the 40–49 band, 11 in the 50s, 10 at 60+. Publishing a median from ten people as if it were a norm would look authoritative and mean nothing.
So we did the honest thing available: we made the band coarser instead of the number softer. "40 and older" holds 50 riders, which is enough for a median. What we did not do is interpolate the missing bands from the men's curve. If you are a 58-year-old woman, this table gives you an orientation, not a norm — and it says so instead of pretending otherwise.
The same caution applies to the top-10 % column throughout the women's table: with fewer than 100 athletes per band, a 90th percentile is an order of magnitude, not a precise value.
Methodology: how we built these tables
Our full record holds 16,944 performance tests. Of those, 10,720 passed the automated quality check (valid) — a test can fail it for bad power data, an aborted protocol, or an implausible curve fit. From the valid tests we took the 9,310 cycling tests, because running power is measured differently and would not belong in a watts-per-kilo table.
From there, four filters, each with a reason:
- Confirmed year of birth, because the table is organised by age. This is the expensive one — it cuts the pool substantially, since not every athlete fills in their birth year.
- Plausibility bounds of 1.0 to 8.0 W/kg, to drop broken weight entries and corrupted test records.
- Plausible test date, from 2020 onwards — this removed eight records: one carrying no date at all, three from before the window, and four stamped in the future, two of them dated 2041.
- Plausible age at the test, 14 to 85, which removed the last seven — among them a birth year entered as "1" and six records that would put the rider between 87 and 98.
What remains: 6,665 tests from 1,710 athletes — 1,517 men and 193 women, as of August 2026.
That gap between tests and athletes is the part most cohort tables get wrong. Our riders test on average about four times, and the keenest test far more often. Counting every test as a data point would let one highly motivated athlete appear a dozen times and quietly pull the median toward the well-trained end. So each athlete enters exactly once, with their best valid test.
The number itself is the one-hour power derived from the Powertest: critical power plus the anaerobic work capacity spread across an hour, divided by the body weight recorded at that test. That is the quantity FTP is meant to describe, and it sits about 2 % above the critical-power asymptote alone.
Why the curve falls — and it is not only the legs
The men's median drops from 4.95 W/kg under 30 to 3.23 W/kg at 60+. That is a loss of just over a third. The obvious story is ageing muscle. The data tells a more useful one. Every column below is the median for that band:
| Age (men) | Watts | Weight | W/kg |
|---|---|---|---|
| under 30 | 340 W | 69.0 kg | 4.95 |
| 30–39 | 316 W | 74.0 kg | 4.30 |
| 40–49 | 299 W | 75.0 kg | 4.00 |
| 50–59 | 275 W | 76.0 kg | 3.63 |
| 60+ | 256 W | 77.5 kg | 3.23 |
Look at the two middle columns. Power falls by 84 watts — 340 down to 256. Body weight climbs by 8.5 kg. Now run the counterfactual on that constructed median rider: producing his 256 watts at the under-30 group's median weight, he would sit at 3.71 W/kg instead of the 3.30 W/kg his own two columns give him today. That is 0.41 W/kg the scale takes off him. Close to a quarter of the age-related decline in watts per kilo is standing on the scale, not sitting in the muscle.
Why 3.30 and not the 3.23 in the last column: that column holds the median of each rider's own ratio, and a median of ratios is not the ratio of medians. Dividing the watt column by the weight column builds a rider who does not exist — useful for isolating the weight effect, wrong for reading off a norm. It is the same discipline that keeps the tables above honest, so it applies to our own argument too.
That is not a diet lecture, it is a statement about which lever is available. Rebuilding the 84 watts that separate the oldest band from the youngest is a multi-year project with a low ceiling, and for most riders in their sixties an unrealistic one. Eight kilos is a different kind of problem — and the same eight kilos also cost you nothing to carry when you take them off.
For women the picture genuinely differs: median weight stays flat across the bands (60.0, 61.0, 61.0 kg) while watts fall from 239 to 205. Whatever drives the decline there, it is not the scale. With 193 women in the cohort we will not over-read that, but it is the opposite pattern to the men's, and it is worth naming.
One caveat that any honest reading needs: this is a snapshot across different people, not the same riders followed for thirty years. Part of what looks like ageing is a difference between generations of riders — who started when, who trains how. A true ageing curve needs decades of the same athletes, and nobody has that yet.
What these numbers are not
They are not the average cyclist. Every rider here owns a power meter, cared enough to run a structured performance test, and uses a training platform. That is a self-selected group, and it sits well above the general cycling population. A median of 4.95 W/kg for men under 30 is not "normal for young men" — it is normal for young men who train with data.
Read the tables as: where do I stand among riders who take this seriously? If you have just bought your first power meter and land at 2.8 W/kg, you are not below average as a cyclist. You are at the start of the group that measures itself.
Watts per kilo or raw watts — which is your number
Both, depending on your terrain and your goals.
- Climbing and hilly racing: watts per kilo, almost exclusively. Gravity does not care about your frontal area.
- Flat riding, time trials, breakaways: raw watts, with aerodynamics as the second term. The 90 kg rider at 300 watts wins that day.
- Zwift and indoor racing: a hybrid, and closer to W/kg than most riders expect — which is why the category system is built on it. We unpicked that in Zwift categories and Racing Score.
If your median comparison looks discouraging in one column, check the other. Plenty of riders sitting at an unremarkable W/kg are pushing raw watts that make them formidable on flat roads.
What riders actually change
Among the athletes with at least two tests — about 900 of them — we compared the first test with the most recent one. Not the best one: taking someone's peak result out of five tests and calling it progress would flatter us systematically.
Median change: just under 3 %, roughly 0.11 W/kg, over a median span of about ten months. Roughly six in ten riders improved.
That is a deliberately unglamorous number, and it is the useful one. Three percent in ten months does not sound like a transformation, but it is the honest middle of a group that includes riders in their first structured season and riders who were already close to their ceiling. Compare it to the age gradient: the median gap between the 40–49 and 50–59 bands is 0.36 W/kg. At the observed rate of improvement, consistent training buys back a meaningful share of a decade — which is exactly what you would hope, and considerably less than most training marketing promises.
Where your own number comes from
If you want your row in this table, you need a threshold number that is worth comparing. Three routes, in ascending order of what they tell you:
- A 20-minute test times 0.95. Cheap, repeatable, and a solid single number — it just doesn't split the engine into its parts. It also reacts strongly to pacing and day form.
- A ramp test, like Zwift's. Faster and less miserable — and spot-on for the average rider: applied to 1,818 ramp tests on Zwift's protocol, its 0.75 rule lands within 1.4 W of the modelled hour power on average. Where it drifts is the individual: riders with a large anaerobic capacity ride the last minute higher and get a threshold above what they can hold; diesels get the reverse. We measured both in our Zwift FTP test analysis and compared the protocols in Zwift FTP test protocols.
- A Powertest. Instead of one number, it separates the engine into its parts — VO2max, VLamax, critical power, anaerobic capacity, fat and carbohydrate rates. Two riders with identical threshold power can need opposite training, and that only becomes visible when the number is split.
Moving your number
- Raise the ceiling. Threshold power is capped by aerobic capacity; you cannot push the threshold far above what the engine supplies. Work on VO2max first if you are far from your ceiling — the five methods that actually work are the starting point.
- Lower the lactate cost. A high VLamax raises glycolytic flux and pulls your threshold down even when VO2max is strong. Long, steady, low-carbohydrate-availability endurance work is the classic lever here.
- Ride threshold work with intent. Sweet spot and threshold intervals do move the number, but they are the finishing tool, not the foundation. The Zwift workouts worth doing sort them by rider type.
- Address the denominator. As the weight column shows, this is the fastest lever for many riders over 40 — and the one most training plans quietly ignore.
- Retest, and track the trend, not the day. Single tests scatter. What matters is the direction over months, which is what our Kalman-filtered fitness curve was built to extract from noisy data.
Find your row
Compare your own threshold power against these tables, then find out which part of your engine is holding it back.
Start your free trial — get your training plan and your fitness curve, and run a Powertest to see your VO2max, VLamax and critical power as separate numbers instead of one blurred average.
One more thing
There is a number in these tables that we did not show you, and it explains more than any of the columns above: two riders in the 40–49 band, both sitting exactly on the 4.00 W/kg median, can have completely different engines behind that identical number. One is an aerobic diesel with a low glycolytic rate. The other has a big VO2max dragged down by a VLamax that burns through carbohydrate at threshold. Same table row, opposite training weeks.
That second axis is VO2max — and the value only becomes readable once you stop compressing your physiology into a single watt figure.
FAQ
What is a good FTP in watts per kilo? Among the riders in our cohort, the median is 4.95 W/kg for men under 30 and falls to 3.23 W/kg at 60+; for women it runs from 4.07 to 3.48 W/kg. But "good" only means anything against your own age band and your own terrain — compare within your row, not against the top of the table.
Is my FTP low for my age? Find your band above and compare to the median column. If you are below it, that places you in the lower half of riders who test with us — which is a self-selected, well-trained group, not the general cycling population. It is a starting position, not a verdict.
Why do you show fewer age bands for women? Because we have 193 women in this cohort, and split by age, every band from 40 upward falls under 30 athletes. Our rule is that a row under 30 athletes does not get published as a norm. We combined those into a single "40 and older" band with 50 riders rather than interpolating values we did not measure.
Is this measured FTP or estimated? Both, precisely: the power is measured by your power meter, the threshold is derived from that power using the Mader model. There is no blood lactate measurement involved. We keep the distinction because it helps you compare numbers from different tools fairly.
How does this compare to a 20-minute or ramp test? It is the modelled one-hour power. Against a ramp test it lands very close on average — in our data, the 0.75 factor is off by only 1.4 W on average. Riders with a high anaerobic capacity see the ramp read higher, diesels lower. A well-paced 20-minute test times 0.95 is usually reasonably close too.
Does watts per kilo matter if I only ride flat roads? Much less. On the flat, raw watts against aerodynamic drag decide the outcome. W/kg becomes the dominant term as soon as the road tilts up; on rolling terrain both matter.
How often should I retest? At least once a year — more often is better; every eight to twelve weeks is a good rhythm for most riders. The athletes in our repeat-test group moved their number by a median of just under 3 % over about ten months — testing monthly mostly measures your day form, not your training.
Cohort data: 6,665 valid cycling Powertests from 1,710 athletes, recorded through August 2026. Threshold model per Mader & Heck 1986 (Int J Sports Med, 7 Suppl 1:45–65) and Mader 2003 (Eur J Appl Physiol, 88:317–338). Percentile bands with fewer than 100 athletes are reported as orders of magnitude; bands under 30 athletes are not published. Full derivation in the methodology section above.