Cos'è un buon aeroTEST: materiale, strada, setup (2026)
Immagina due ciclisti, stessa strada, stesso cambio di casco. Uno torna a casa sicuro che il casco nuovo valga qualche watt. L'altro non sa dirlo, e lo compra lo stesso. La differenza non era il casco e non era la strada. Era il modo in cui ciascuno dei due ha testato. Un aeroTEST è una misura, e come ogni misura ha un pavimento di rumore che puoi abbassare o alzare con le tue mani. Questa guida copre i fattori che controlli tu, dal misuratore di potenza all'ordine dei tuoi setup, compresa una relazione che abbiamo quantificato su 7.177 setup outdoor sulla nostra piattaforma.
Sei nuovo al protocollo in sé? Parti dalla guida aeroTEST passo dopo passo. Questo articolo parla di come farlo bene.
Cosa vuol dire "buono"
Un buon aeroTEST è uno in cui i passaggi di un setup cadono uno sopra l'altro, e due setup che differiscono per la resistenza di un casco risultano diversi. In numeri: la dispersione del CdA da passaggio a passaggio all'interno di un setup, come quota del CdA. Ogni passaggio sulla piattaforma porta con sé la propria incertezza, riportata come barra d'errore: la piattaforma esegue il fit del passaggio, lo confronta con gli altri passaggi del setup e riporta il maggiore tra l'errore del fit e la discordanza tra i passaggi, come quota del CdA. Trattala come l'indicatore di incertezza della piattaforma, non come un intervallo di confidenza formale. E non copre tutto: un misuratore di potenza che legge il due percento in più per tutto il giorno, o una posizione cambiata tra un setup e l'altro, sposta ogni passaggio nello stesso modo e le resta invisibile. Lo scopo di questo articolo è tenere piccoli entrambi: la barra, e gli errori che la barra non può vedere.
Tre cose determinano il rumore: la strada, la tua attrezzatura e come pedali. La strada fissa il tetto (ne abbiamo misurate 977). Le altre due decidono dove, sotto quel tetto, ti collochi.
Tre livelli di attrezzatura
Lo stesso metodo restituisce numeri molto diversi a seconda di cosa porti. Dalle nostre giornate di test con le squadre e dai dati della piattaforma, tre livelli. Tratta la tabella come una checklist di preparazione, non come una garanzia di una particolare risoluzione.
| Basso | Medio | Alto | |
|---|---|---|---|
| Velocità | solo GPS | GPS | GPS più sensore di velocità, circonferenza misurata |
| Misuratore di potenza | monolaterale | potenza totale di entrambe le gambe | potenza totale di entrambe le gambe, su spider o pedivella |
| Ciclocomputer | qualsiasi | qualsiasi | Garmin Edge con l'aeroAPP |
| Percorso | quello che c'è vicino | piatto, meno di 5 m di dislivello, 500 m | piatto, meno di 5 m, 1.000 m, vento controllato |
| Vento | ignorato | ignorato | di fianco, strada riparata, due percorsi tra cui scegliere |
| Ruote | a profilo alto | qualsiasi | niente profili alti per i test di posizione |
| Abbigliamento | giacca antivento | maglia | assetto da gara, niente che svolazzi |
| Posizione | a memoria | a memoria | punti di riferimento fissi, fotografati |
| Pressione gomme | quella che è | controllata una volta | controllata prima di ogni setup |
Non devi essere al livello Alto per imparare qualcosa. Una sessione Media può risolvere differenze più grandi; se separa due caschi dipende da quanto sono diversi e dall'incertezza di quella sessione. Una sessione Bassa tende a dirti che il casco aero è più lento il martedì e più veloce il giovedì, ed entrambe le volte è la strada che parla.
Tieni la potenza come un metronomo
Questa è la relazione che abbiamo quantificato. Abbiamo preso ogni setup di aeroTEST outdoor sulla piattaforma con almeno due passaggi puliti e ordinato i setup in base a quanto la potenza del ciclista ha oscillato all'interno di un passaggio: la deviazione standard della potenza durante un passaggio come quota della sua media, mediata sui passaggi del setup.
| Variazione di potenza nel passaggio (deviazione standard come quota della media) | Setup | Dispersione del CdA tra passaggi, mediana | Barra d'errore riportata dalla piattaforma, mediana |
|---|---|---|---|
| sotto il 4 % | 190 | 0,52 % | 2,3 % |
| dal 4 a meno del 9 % | 4.296 | 0,71 % | 2,9 % |
| dal 9 a meno del 13 % | 1.835 | 0,96 % | 3,0 % |
| 13 % e oltre | 856 | 1,52 % | 3,8 % |
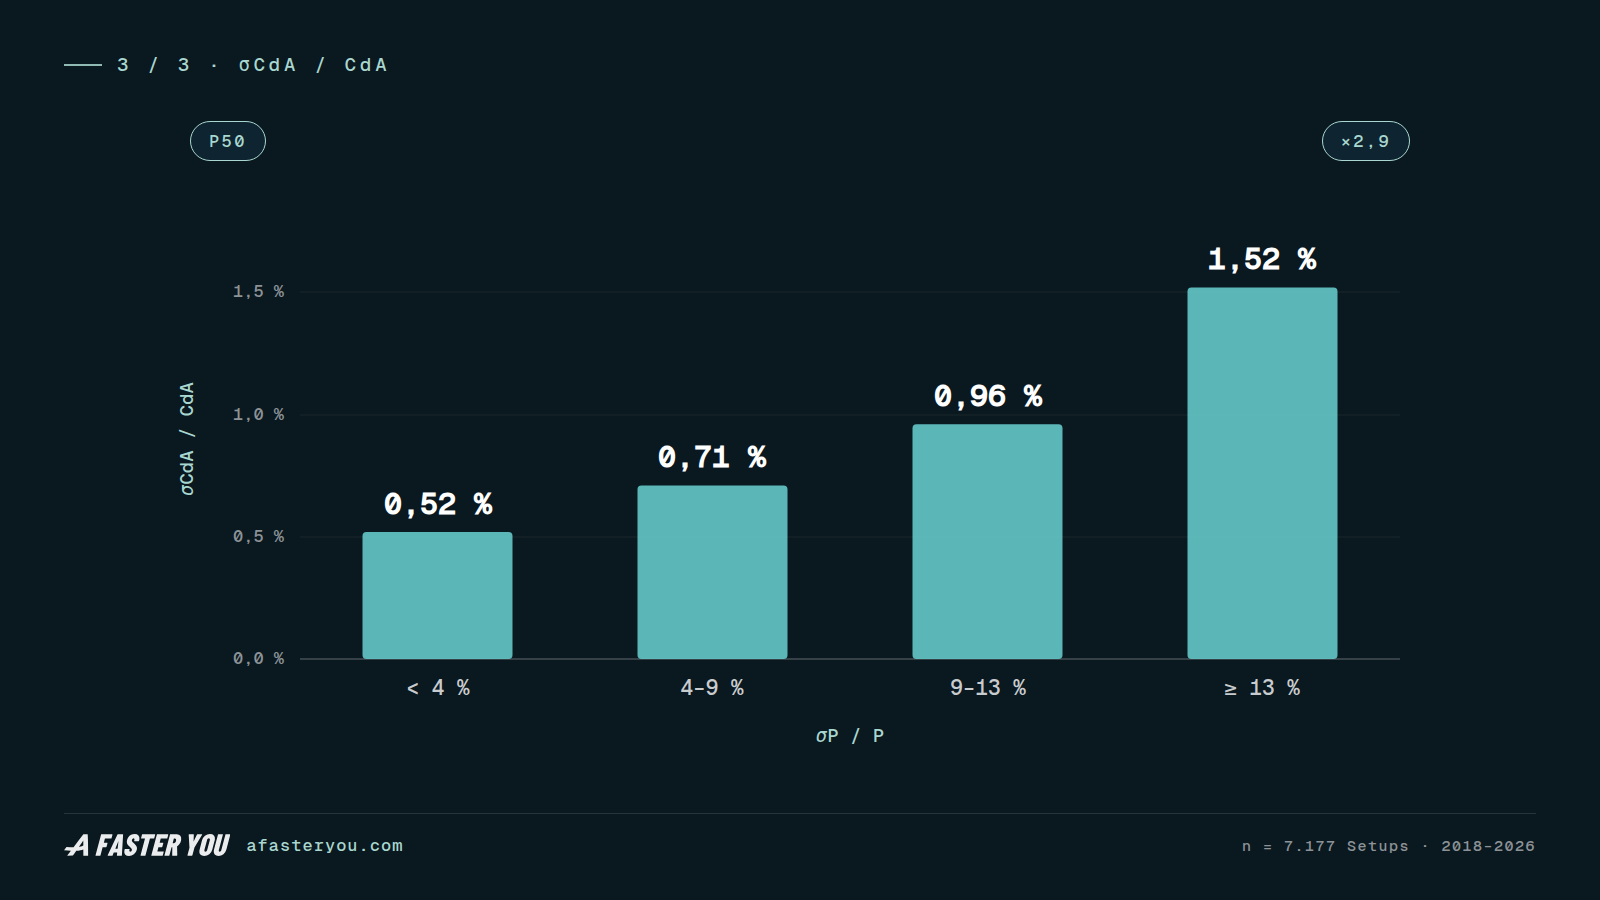
I setup con una variazione di potenza sotto il 4 % hanno mostrato una dispersione mediana tra passaggi di mezzo percento del CdA. I setup con una variazione di potenza del 13 % o più hanno mostrato il triplo, e la barra d'errore che la piattaforma ha riportato a quei ciclisti si è allargata dal 2,3 al 3,8 %.
Parte del divario è il numero di passaggi: un setup che contiene più passaggi mostra più dispersione per costruzione, e il gruppo meno stabile ne ha leggermente di più. Così abbiamo ripetuto il confronto tra setup della stessa lunghezza:
| Variazione di potenza | Setup con esattamente 2 passaggi | Dispersione, mediana | Setup con esattamente 3 passaggi | Dispersione, mediana |
|---|---|---|---|---|
| sotto il 4 % | 122 | 0,31 % | 51 | 1,51 % |
| dal 4 a meno del 9 % | 2.413 | 0,53 % | 1.431 | 1,18 % |
| dal 9 a meno del 13 % | 1.006 | 0,63 % | 621 | 1,61 % |
| 13 % e oltre | 413 | 0,74 % | 324 | 2,14 % |
A due passaggi, il gruppo meno stabile disperde 2,4 volte tanto quanto il più stabile. A tre passaggi, il gruppo più stabile conta solo 51 setup e finisce sopra quello successivo, quindi lì la sequenza non è monotona; dal secondo gruppo al meno stabile la dispersione sale comunque di 1,8 volte. I ciclisti più stabili sono anche andati più veloci, 44 contro 39 km/h in media, e la velocità da sola affina la risoluzione (il perché). Quindi leggila come un'associazione su migliaia di sessioni reali, non come un esperimento controllato: stabilità, velocità ed esperienza viaggiano insieme, e non le abbiamo separate.
Perché la stabilità dovrebbe andare di pari passo con la dispersione? La nostra spiegazione migliore, non qualcosa che questa analisi ha misurato: uno scatto sposta la potenza nel far cambiare la velocità invece che nel vincere la resistenza, il che rende il fit più sensibile al rumore nei dati di velocità, e un ciclista che scatta è più probabilmente un ciclista che si muove: testa su, spalle aperte, un'area frontale diversa per qualche secondo. La piattaforma ti mostra la stabilità dopo ogni passaggio nel pannello della qualità di pedalata, come regolarità della potenza. Guardala prima di guardare il CdA.
Cosa significa per la tua potenza di test: scegli la potenza più alta che riesci a tenere stabilmente per ogni passaggio della sessione che hai pianificato, non la più alta che riesci a tenere. Quando la deviazione standard della tua potenza comincia a salire nella seconda metà di una sessione, la tua posizione la sta seguendo. Fermati, o accetta barre più larghe.
Metodologia: come abbiamo costruito questa tabella
Ogni cifra viene dai dati di test archiviati su afasteryou.com. Da 13.000+ sessioni outdoor dal 2018 abbiamo selezionato deliberatamente gli aeroTEST out-and-back validi e, al loro interno, ogni setup dopo il passaggio di calibrazione con almeno due passaggi puliti, senza flag di errore né di outlier: 2.176 aeroTEST su 812 strade, 7.190 setup, 7.177 dei quali con dati di potenza. La variazione di potenza è la deviazione standard della potenza all'interno di un passaggio divisa per la media del passaggio, mediata sui passaggi del setup; i gruppi sono sotto il 4 %, dal 4 a meno del 9 %, dal 9 a meno del 13 % e 13 % e oltre. La dispersione è la deviazione standard del CdA sui passaggi del setup divisa per la media del setup; riportiamo la mediana tra i setup di ogni gruppo, e la ripetiamo per i setup di esattamente due ed esattamente tre passaggi. I residui aggregati, lo stimatore usato nell'articolo sulle strade, danno 2,7 %, 3,0 %, 3,2 % e 5,1 % per i quattro gruppi. Rimuovere i passaggi con flag abbassa la dispersione meccanicamente, quindi i numeri descrivono ciò che un test pulito e strutturato sulla piattaforma ha prodotto, non ogni sessione mai fatta. Aggiornato a settembre 2026.
Il misuratore di potenza
- La potenza totale batte una gamba raddoppiata. Un misuratore monolaterale misura una gamba e la raddoppia, assumendo un bilanciamento costante. Se il tuo bilanciamento deriva nel corso di una sessione, la lettura raddoppiata deriva con esso, e la piattaforma legge quella deriva come resistenza.
- Calibra una volta, all'inizio, a caldo. Poi lascialo stare. Uno zero-offset a metà sessione sposta ogni passaggio successivo rispetto a ogni passaggio precedente.
- I sistemi su spider e pedivella che misurano entrambe le gambe (SRM, Quarq e Power2max sono quelli che le nostre raccomandazioni di test citano dal 2022) sono la nostra raccomandazione. Vanno bene anche i pedali bilaterali. Ciò che conta è la potenza totale di entrambe le gambe, misurata nello stesso modo per tutto il giorno.
Velocità
La velocità è metà dell'equazione, e la velocità GPS è la metà più rumorosa. Un sensore di velocità con la circonferenza misurata riduce sostanzialmente quel rumore. Misura la circonferenza con un metro e inseriscila a mano; non lasciare che il ciclocomputer tiri a indovinare, perché la sua stima può cambiare tra un passaggio e l'altro, e tienila invariata per tutta la sessione. Controlla la pressione delle gomme prima di ogni setup, non una volta la mattina: la pressione cambia la circonferenza, la circonferenza cambia la velocità, la velocità cambia il CdA.
La strada, in breve
Ci abbiamo scritto un intero articolo; la versione corta:
- Un chilometro dritto, piatto, meno di 5 m di dislivello. Le curve vanno bene se restano sotto i 30 gradi.
- Vento di fianco. Percorrere entrambe le direzioni dà al modello osservazioni opposte, il che gli permette di separare la tua resistenza da un vento costante lungo la strada. Le raffiche e un angolo del vento che cambia tra i due tratti costano comunque ripetibilità, quindi scegli la strada che mette il vento prevalente di traverso alla tua traiettoria.
- Due percorsi, uno grosso modo nord-sud, uno est-ovest, e le previsioni decidono quale percorri oggi.
- Riparo: file di alberi, terrapieni. Ma non un varco tra due boschi: un varco fa da imbuto.
- Niente profili alti per i test di posizione. Una ruota a profilo alto fa vela con il vento laterale, e fa vela in modo diverso a ogni raffica. Ruote a profilo basso per tutto ciò che non è un test di ruote.
Costruire i setup
Il primo setup si guadagna la tua fiducia. Su una strada nuova, o il primo giorno con una bici nuova, dai alla baseline quattro o cinque passaggi. Se concordano entro l'incertezza riportata, hai una verifica di stabilità per quel momento: la strada, i sensori e la tua posizione si comportano bene. Non è una prova che ogni differenza successiva sia reale; quello dipende comunque da ogni confronto e dalla sua incertezza.
Un cambio per setup. Casco e skinsuit insieme ti dicono la somma, e la somma è inutile quando il casco era peggiore e la tuta era migliore.
Le ruote hanno un ordine. Testa prima le ruote posteriori, con il sensore di velocità sulla ruota anteriore. Poi le anteriori, con il sensore spostato dietro. La ruota che non stai testando dovrebbe essere un semplice cerchio a profilo basso, così non aggiunge un effetto vela proprio.
Torna alla baseline. Rifalla alla fine. Se la baseline di chiusura concorda con quella di apertura, la tua fiducia nella sessione sale, anche se due estremi che combaciano non possono provare che ogni setup nel mezzo abbia visto le stesse condizioni. Se non concorda, le condizioni o l'esecuzione sono cambiate da qualche parte nel mezzo. Non puoi dire esattamente quando o di quanto, ma sai fino a che punto fidarti dei confronti nel mezzo. Nelle sessioni lunghe, fai la baseline una terza volta a metà.
Niente che svolazzi. Niente giacca, niente numero che sbatte, niente maglia aperta. Il tessuto lento è resistenza che cambia ogni secondo; il metodo non può mediarla.
Cosa testare
La lista che i ciclisti ci portano, nell'ordine che di solito paga:
- Prima il tuo corpo. Circa l'80 % della resistenza sei tu, non la bici (il perché, e cos'è un buon CdA). Angolo del busto, posizione di testa e spalle, larghezza delle braccia. Un biomeccanico decide se una posizione è sostenibile; un aeroTEST decide se è più veloce. Usali entrambi.
- Casco, e con lui la questione visiera contro occhiali, e l'angolo della testa con cui pedali davvero. Un casco testato con la testa alta e usato in gara con la testa bassa non è mai stato testato.
- Skinsuit: pezzo unico contro due pezzi, manica corta contro manica lunga, body da triathlon contro tuta aero. Poi i copriscarpe.
- Borracce: sul tubo obliquo, dietro la sella, sulle prolunghe, o nessuna per una gara corta.
- Attacco manubrio, prolunghe, altezza sella: piccoli cambi di posizione che puoi fare con una brugola a bordo strada.
- Telaio e ruote dopo posizione e abbigliamento, a meno che il telaio o le ruote non siano proprio la decisione che devi prendere. I loro guadagni dipendono dal resto del setup, dalla velocità e dall'angolo del vento, e le ruote hanno bisogno dell'ordine descritto sopra.
Che aspetto ha un buon setup
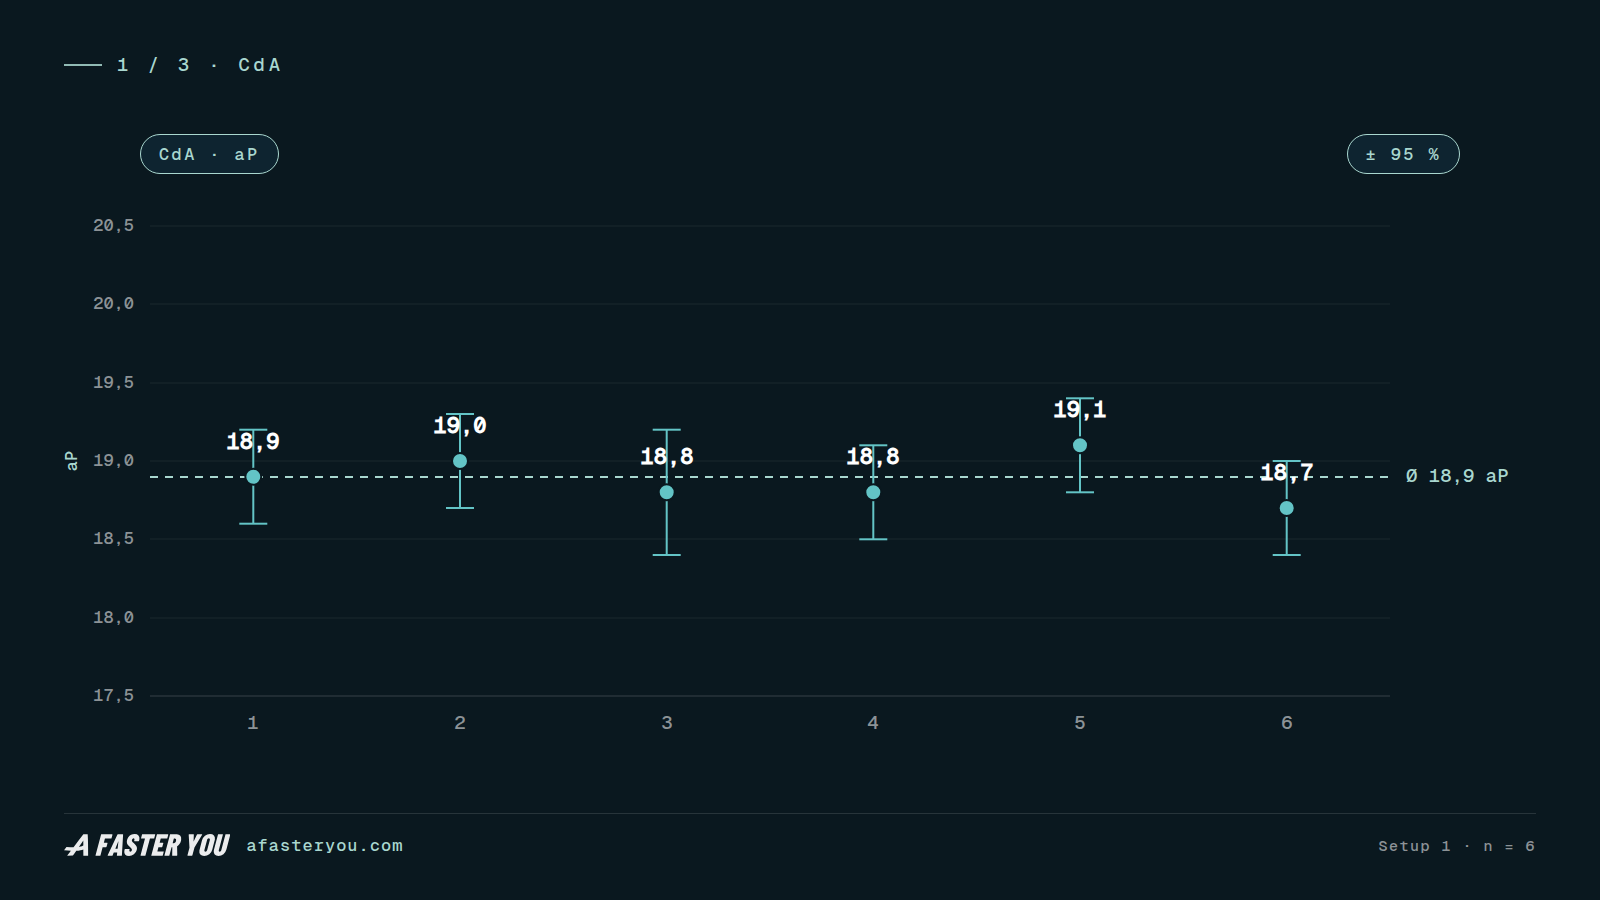
Sei passaggi, un setup, da un aeroTEST outdoor anonimizzato sulla piattaforma, 2022. Il CdA è in aero points: 1 aP è 0,01 m². Ogni passaggio sta dentro le barre d'errore degli altri, l'intero setup entro 0,4 aP, cioè 0,004 m². Questo è un ciclista che ha tenuto posizione e potenza. La media, 18,9 aP, è una baseline precisa per ogni confronto in quella sessione, purché gli altri setup siano fatti nelle stesse condizioni. Preciso non è lo stesso che assolutamente giusto: un misuratore di potenza che legge in eccesso per tutto il giorno sposterebbe tutti e sei i passaggi insieme.
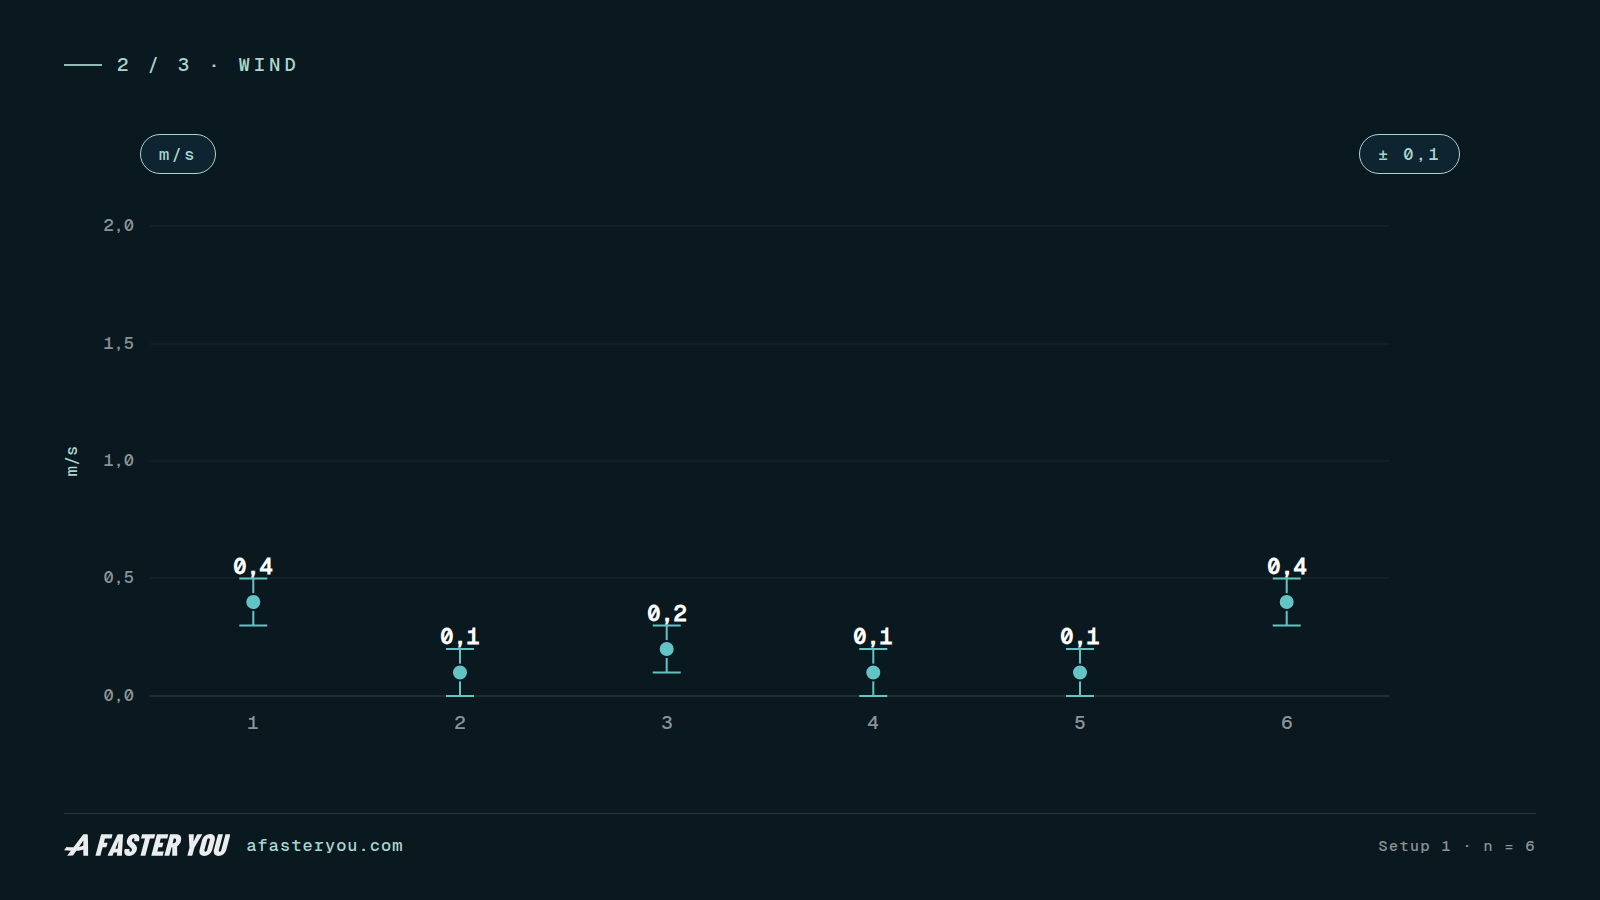
Il grafico del vento qui sotto è il motivo. La piattaforma ricostruisce il vento effettivo dai due tratti di ogni passaggio; qui non esce mai dai decimi di metro al secondo. Un passaggio che schizza mentre i vicini restano piatti indica una raffica o un problema del passaggio stesso, e il suo CdA starà spesso fuori dagli altri. Controllalo insieme alla sua barra d'errore e al flag di outlier che la piattaforma imposta. Non cancellarlo; fanne un altro.
Un setup cattivo ha l'aspetto opposto: passaggi che sballottano su e giù di un aero point intero, barre d'errore che non si sovrappongono, un grafico del vento con i denti. La soluzione non è quasi mai nel software. È una giacca, una raffica, una gomma, o un ciclista che si è alzato negli ultimi cento metri.
Pronto a testare? Crea il tuo account gratuito, pianifica una baseline e un cambio, e fai il tuo primo aeroTEST outdoor.
FAQ
Un misuratore di potenza monolaterale basta? Produrrà un numero. Il numero è una gamba raddoppiata, e il tuo bilanciamento tra le gambe si muove nel corso di una sessione. Se è quello che hai, tieni le sessioni corte e aspettati barre d'errore più larghe.
Dovrei testare a potenza più alta per avere un segnale più forte? Solo quanto riesci a tenere stabilmente per tutta la sessione. Nei nostri dati, le mediane aggregate differivano di circa tre volte tra i setup più stabili e i meno stabili, e i confronti a numero di passaggi fisso erano più piccoli e non uniformemente monotoni; un'associazione, non un effetto garantito. Comunque, qualche watt in più non ricompra ciò che l'instabilità costa. Scegli la potenza di gara e tienila come un metronomo.
Quanti setup stanno in una sessione? Sei o sette sono un pomeriggio pieno: calibrazione, una baseline di apertura, tre o quattro cambi e una baseline di chiusura. Di più, e la fatica comincia a comparire come dispersione nei setup finali.
Posso testare la posizione con ruote a profilo alto? Puoi, ma ogni raffica finirà nel risultato della tua posizione come effetto vela. Monta ruote a profilo basso per i test di posizione e abbigliamento; testa le ruote a profilo alto come test di ruote, in un setup a parte.
Giacca antivento per il freddo? Tra un setup e l'altro, sì. Durante un passaggio, mai. Una giacca che svolazza non è un CdA stabile, e nessun numero di quel passaggio significa qualcosa.
Lo stesso setup dà lo stesso CdA in un altro giorno? Non necessariamente lo stesso numero assoluto: angolo del vento, temperatura, come veste la tuta, quanto bene hai riprodotto la posizione e la semplice incertezza di misura lo spostano tutti. I confronti all'interno di una sessione sono di solito i più difendibili, a condizione che la baseline abbia tenuto e che la differenza sia più grande dell'incertezza. Tra un giorno e l'altro, confronta attraverso la baseline che hai ripetuto in ogni sessione.
Fonti: analisi della stabilità di potenza dai dati di aeroTEST outdoor archiviati su afasteryou.com, dal 2018 a settembre 2026 (7.177 setup; vedi il box di metodologia). Esempio a sei passaggi: aeroTEST outdoor anonimizzato sulla piattaforma, 2022. Raccomandazioni di protocollo (passaggi per setup, ordine delle ruote, calibrazione, circonferenza): le raccomandazioni di test aeroTEST e il metodo come implementato su afasteryou.com, settembre 2026. Dispersione a livello di strada: Test aero outdoor: perché la tua strada conta, 8.566 setup su 977 strade, agosto 2026. Risoluzione per velocità e significato della barra d'errore: Test aero in velodromo. Quota di resistenza dovuta al corpo del ciclista e CdA tipico per posizione: Aerodinamica nel ciclismo: come testare e migliorare il tuo CdA. Fisica: Martin, J.C. et al. (1998), Validation of a mathematical model for road cycling power, J Appl Biomech 14(3):276–291.